Google Ads Campaign Experiments: How To Properly Read Performance Stats & Avoid Reporting Confusion


Google Ads experiments are kind of my favorite thing. There's just something awesome about being able to test a new tactic against your tried-and-true campaign setup and see how said changes will impact performance using real-life user data. Ahh, sweet, sweet optimization. But while I could go on all day about how amazing campaign experiments are (ease of setup, actionable data, yadda-yadda) this post is not a love letter to Google Ads. In fact, it's quite the opposite. For all of the wonderful insight that experiments give us, what they do to high-level performance reporting is atrocious... and you probably don't even know it's happening (I sure didn't).
I'll pause for a moment while you consider the fact that a Google product isn't 100% perfect.
Get through that OK? Good. Strap in.
Campaign Experiments Reporting: You're Doing It Wrong
Not you, dear reader. But Google. Yes Google, you're doing it wrong! The way experiment data gets pulled into overall campaign reporting is confusing as heck...
When you check in on how your campaign experiments are doing, you're probably looking at the experiment itself, within the All Experiments view. Good, keep doing that! What about when you want to review overall campaign performance, or even your account as a whole? The All Campaigns view - yes, good job. If one or more of those campaigns have an experiment running, there's no doubt you'd like to see those spends, conversions, etc. alongside everything else when you're doing a high-level spot check. This is the part where I have beef with Google Ads.
For the sake of example, let's say you're running an experiment right now and you're looking at data in the various views across the Google Ads interface. Based on your experience with the platform, you assume there's consistency across reporting views. And based on your experience with the English language, you assume that the word "total" means the sum of all parts. But you know what they say about how you should never assume - the whole making an @$$ of you and me thing...
If you've poked around your account enough when experiments are running, you might have noticed a discrepancy between the campaign-level data you see in one view versus the campaign totals in another. Something is amiss, and that's because original campaign data and experiment stats are pulled into different places in different ways. So because of that, you (reader) might be interpreting your data wrong (I was). It's OK though, we're here to change that.
How It Actually Works
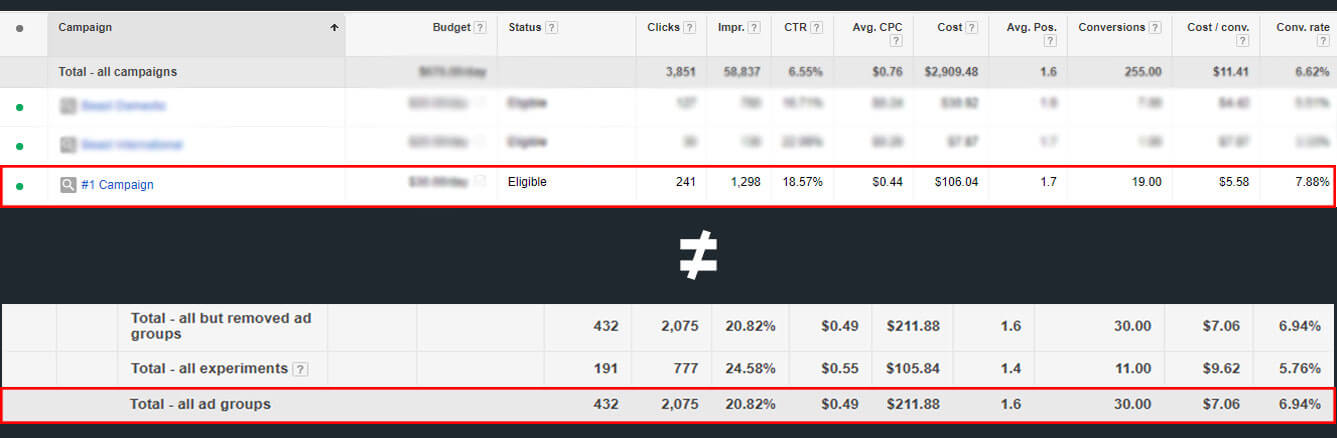
In The All Campaigns View:
- Individual Campaign Lines: the stats for only the "original" version of each particular campaign
- there is the option to apply "Experiment" as a segment here, which I think would provide a better understanding of performance breakdowns if it worked... but I believe it is broken (at time of publishing) - for campaigns I'm currently experimenting with, as well as those which had experiments running in the past (yet inside my reporting window), it shows the same breakdown as it does for campaigns with no experiments at all
- each campaign has only one segment, "Outside Experiment," which shows a complete duplication of the overall campaign data - 50% split or not, there's absolutely no way this is accurate as adding up each of the segments does not line up with the numbers in the Total - All Experiments line as you'd expect it to if this was legitimate, and subtracting it from the total leaves you with zeroes across the board... which can't be your experiment total either
- if you're having the same experience, or better yet seeing something different, please holler in the comments below!
- there is the option to apply "Experiment" as a segment here, which I think would provide a better understanding of performance breakdowns if it worked... but I believe it is broken (at time of publishing) - for campaigns I'm currently experimenting with, as well as those which had experiments running in the past (yet inside my reporting window), it shows the same breakdown as it does for campaigns with no experiments at all

- Total - All But Removed (or whatever your selection) Campaign: the sum/average of stats across all "original" campaigns which haven't been removed (or whatever your selection) as well as the experimental version of said campaigns
- Total - All Experiments: the sum/average of stats across all the experimental versions of your campaigns
- Total - All Campaigns: the sum/average of stats across ad groups, including experiments - essentially your overall account total
In The Ad Groups Tab Of A Single Campaign View:
- Individual Ad Group Lines: the stats for only the "original" version of each particular ad group
- one might hope that this would either include experimental data at the ad group level and have a way of showing it (perhaps via segments?) - OR - show the experimental version of the ad group separately, but no
- hint: you can see the experiment data at the ad group level from within the experiment view, just not here
- Total - All But Removed (or whatever your selection) Ad Groups: the sum/average of stats across all "original" ad groups which haven't been removed (or whatever your selection) as well as the experimental version of said ad groups
- yes, even though the experiment data isn't included in each ad group line, it is included in the total of those lines :/
- Total - All Experiments: the sum/average of stats across all ad groups in the experimental version of your campaign
- Total - All Ad Groups: the sum/average of stats across ad groups, including experiments - essentially your overall campaign total
- and this is your campaign's real total (how much you've actually spent, how many conversions you've actually accumulated, etc.) - trust me, I've done the math over and over again
- remember: this "campaign" total will not match the campaign line item in the All Campaigns view - that line includes only data from the original version of your campaign
- these numbers will not match up and unfortunately the only way to reconcile this is to be aware of the discrepancy and remember to account for it
What Happens At The End Of An Experiment?
Unfortunately, the confusion doesn't end when your experiment does. Sigh...
In the section above, I alluded to the fact that the Total - All Experiments line contains data from any/all experiments running during the reporting period. This makes sense based on everything we've learned so far, however it conflicts with what I was told by my friendly neighborhood Google rep in the help chat (more on that subject later).
What Google Told Me
Once an experiment ends, the performance data "moves" into the line item for the original campaign; thus moving out of the Total - All Experiments line as well.
But Riddle Me This
If an experiment ends and its data is now part of the original campaign's performance stats, why is it that when you look back at historical data, the Total - All Experiments line is still there... and still displays experimental stats? And the line item for the campaign doesn't, in fact, include the results of the experiment?
The Answer
The answer is because you're looking in the All Campaigns view. And you know you can't trust what you read there. So just like with an existing experiment, if you want to actually see total performance of a campaign and its experiment in the past, you'll need to navigate to the Ad Groups tab within that individual campaign to review your data. There you will see:
- Total - All Experiments: again, this line shows you the data strictly from your experiment as a way of highlighting its performance
- Total - All Ad Groups: again, this line shows you the totals across all of your original ad groups, as well as the experiment's data
At least Google Ads is consistent with its inconsistencies, right? Silver lining (barely).
How To Deal With The Data Discrepancies
All of the above might make you feel like running a campaign experiment in Google Ads just isn't worth it. And trust me, I feel you.
But when it all boils down, knowing how changing a particular setting can affect your campaign's performance totally outweighs the associated frustration. To make things a little bit easier, here are some quick-and-dirty tips/best practices/general reminders to keep handy when you're testing:
- Use Labels: label the campaigns you're experimenting with so that every time you look at any reports you are reminded to analyze the data properly
- Since we know historical data gets muddy too, try assigning labels like "Currently Testing" and "Experiment Ended" - developing a system for yourself will help keep things organized for many reporting periods to come
- Regularly Visit Your Ad Groups Tab: make it a habit to click through to the individual campaign's reporting (the Ad Groups tab) to see a real breakdown of how things are going for your original campaign and its experiment
- Billing Is Billing, Is Billing: budget management is a bear with all the manual math associated with the convoluted reporting for experiments - so if you're strictly looking for actual spends, just visit the Billing & Payments screen
- obviously this is not too helpful since this is an after-the-fact view of costs, but still good for clearing up any confusion that may arise later on
And for my final recommendation on dealing with the issues caused by muddy campaign experiment reporting...
Damn The Man! Let Google Know The Campaign Experiment Data Is Messed Up
I file this whole thing under the definitely worth bringing to Google's attention category. It's not just a frustration with the way Google Ads goes about things - it's a legitimate deficiency with the interface. Not only does a campaign's performance data conflict with itself depending on where you look, there's simply no documentation (at the time of publication, anyway) anywhere in Google's help center that explains how this all works.
What's worse? Google's very own customer support staff doesn't even understand what's going on with this!
Upon sniffing out that something was off with the math, my team and I reached out to Google for help three different times - each resulting in a different answer. First we were assured that the experiment data was "highlighted" in its own line but that it was also included in the total. The second time we were told that the experiment data was absolutely not included in the total. And the third time [raised_hands emoji] we were fortunate enough to get a rep that dug deep, deep to bring us the insight which I have just shared with you. Guess what - it was all a surprise to him too.
This wonderful - and I mean that sincerely, no sarcasm here - rep also said that for the one person asking (me) there were likely 100 more folks frustrated yet not speaking up. And think of the hundreds more still unaware that this is even an issue. My point? If you're running experiments - hit Google up via the phone, live chat, or even email to voice your frustration with this confusing reporting. With the impending launch of the new Google Ads interface, the time to get our gripes in about features is NOW.
Oh, and do be kind and share this knowledge with your fellow advertisers. Remember: friends don't let friends misinterpret their data!
Stay sane; over and out.
Meet the Author

Jess Budde
Jess is our Director of Marketing Operations & Client Services, and the co-host of our weekly Marketing O’Clock podcast. She joined Cypress North in 2013 and works out of our Buffalo office.
Jess works closely with both our clients and our internal team, overseeing account staffing to ensure client satisfaction. She works to facilitate cross-departmental collaboration internally, and acts as an account lead for a few of our clients. Jess also explores new opportunities for our existing clients and prospects.
A Western New York native, Jess graduated with a Bachelor of Arts in communication studies from Niagara University before attending Syracuse University, where she earned her master’s degree in television, radio, and film. Before joining Cypress North, she worked in series development, talent, and casting at MTV during the golden era with Jersey Shore.
When Jess isn’t working or staying up to date on the latest digital marketing news, she enjoys spending time outside, hanging out with her son, and watching the entire Sons of Anarchy series on repeat. You may also find her slinging beers at Brewed & Bottled, the bottle shop and craft beer bar she runs with her husband.
Jess is an amateur ornithologist, Limp Bizkit lover, Candy Crush professional, and hot sauce connoisseur who enjoys burning herself into oblivion with the hottest sauce she can find.
Related Resources

AI Max for Google Ads: My Takes as a Digital Marketer
Google Ads just announced its new AI Max feature. Greg Finn breaks down the good vs. the bad and gives his honest opinions on the update.

How to Control Branded Spend in Google Ads
We all know branded spend can sneak up on you. Learn different ways you can control your branded spend in Google Ads.
Google Ads Brand Lists: How to Use Brand Inclusions & Exclusions in Search & PMax
Showing ads for your brand name may be wasting money you could use elsewhere. Learn how you can use brand lists, inclusions, and exclusions to control your branded searches.
Google Ads Demand Gen Campaigns: From Disappointment to Improvement
Demand Gen campaigns in Google Ads have faced some challenges with attribution and effectiveness. Learn how recent updates can improve visibility and help advertisers make better use of these campaigns.

Are We in a Golden Era of Google Ads?
Is real change coming to Google Ads? Recent changes indicate the team is taking feedback seriously and putting more of a focus on advertisers.
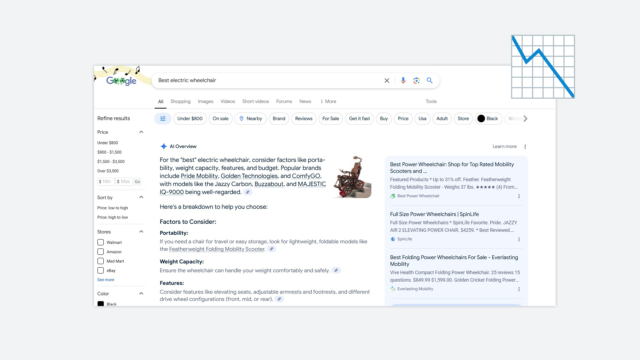
What AI-Driven Search Means for the Future of Publishers
Independent ad-supported publishers face a tough reality with Google’s AI Overviews and zero-click searches. Learn why Google traffic may not be the solution for long-term success.
Why I Changed My Mind About Using PMax
Google is constantly making improvements to Performance Max. Here’s why the former #1 PMax hater changed his mind and now recommends all marketers try this campaign type.

Improve Daily Budget Monitoring in Google Ads with This Simple Script
Managing Google Ads budgets isn’t easy. Here’s a free script you can use to make it less time-consuming and stressful.

Google Launches AI Mode: What it Means for the Future of Search
Google’s new AI Mode marks a major shift in its search strategy. Here’s how we expect it to transform the user experience and future of search.
How Much Are You Really Spending on Your Brand?
Branded spend can sneak up on you when you least expect it. Learn why you should be checking regularly and how to do it effectively.

Multiple Auctions for Different Ad Locations: What Advertisers Need to Know
Google Ads runs multiple auctions for different ad locations. Learn how this impacts Ad Rank, the changes to bidding, and why communication from Google remains unclear.
Google’s RSA Headlines & Sitelinks Update Makes Zero Sense
Google is starting to serve RSA headlines as sitelinks. Here’s what advertisers need to know and why this change makes no sense.

Google Ads Brand Guidelines: Simplifying Advertising and Reducing Fraud
The upcoming changes to brand guidelines will simplify advertising, reduce fraud, and improve account management. See how this may affect you as an advertiser.

The End of Navigation-Less Landing Pages in Google Ads
Google Ads now emphasizes the importance of navigation on landing pages. Learn why this change impacts your campaigns and how to adapt for better performance.

How To Replicate Video Action Campaigns with New Demand Gen Controls
See how Google’s new Demand Gen controls allow you to replicate Video Action Campaigns with channel-specific targeting, making the transition smoother and more effective for advertisers.

How to Succeed with Google PMax Negative Keywords
Google Ads is limiting PMax negative terms to 100 per campaign. Learn more about how to adjust your strategy and make the most of those limited terms.

Why Your Shopping Campaigns May Be Competing with Demand Gen & PMax on YouTube
Find out why your Google Shopping campaigns might show up on YouTube and how turning off the Search Partners Network can help improve targeting and performance.

How to Navigate Potential Bugs and Changes in Google Ads
Learn how to deal with bugs and changes in Google Ads with these practical tips for staying proactive, verifying rumors, and preparing for potential solutions to keep your account performing.

13 Digital Marketing Predictions for 2025
Top Industry Voices Share Their 2025 Digital Marketing Trend Predictions As digital marketers, we know a new year brings new goals, new opportunities for growth, and new challenges. But a new year also brings plenty of change. Whether it’s advancements […]

Google Ads Changes Double-Serving Policy: What To Watch Out For
A Google Ads policy change now allows multiple ads per query. Learn more about how this could impact branded search results and ad spending in 2025.