Microsoft Clarity Benefits & Drawbacks: A Comprehensive Review


Learn more about Microsoft Clarity, and our favorite features from Cypress North’s power users
Updated June 2024 -- It has been two years since this post was first published - time flies! Microsoft Clarity has changed substantially since this post was originally written back in August 2022, and the platform has rolled out several new features that were not touched on in the original post. I wanted to update this Microsoft Clarity review to highlight some of my current favorite features of the platform, and identify how some of the pros and cons identified back in 2022 have changed. I hope you find this updated article helpful! Now back to the original post….
After setting up 24 Microsoft Clarity accounts and counting for various clients, there are some things we’ve come to love about the platform, and frustrations we’ve had to work around. In this post, we break down the pros and cons of Microsoft Clarity, and provide an honest review of the tool. First, let’s start with a definition.
What is Microsoft Clarity?
Microsoft Clarity is a user recording and heat mapping tool that can be used to better understand user behavior on your website. Marketers can use Microsoft Clarity to understand user engagement (scroll depth, clicks), user frustrations (dead clicks, rage clicks), and insights into devices, operating systems, and more.
Here at Cypress North, we love Microsoft Clarity because it’s easy to install, easy to use, and it’s free! In the past, I’ve used Clarity to:
- Look at top performing and underutilized elements on specific pages
- Understand how users move through the main nav and the utility nav
- Understand if users from different countries interact with content on a site differently
Through these different projects, I’ve come to learn more about the platform and all of the exciting integrations available at our fingertips! If you’re looking for a new heatmapping or session recording tool, read on to learn more about our favorite Microsoft Clarity features and some of the disadvantages we’ve found as frequent users of the platform.
The Microsoft Clarity Pros
1. It's free
Yes, you read that right. Microsoft Clarity really is free to install and use! To get started, you first need to sign-in to Microsoft Clarity using your Microsoft, Google, or Facebook account. From there, you can create a new project and install the tracking code onto your site. Two hours later you should have data populating in your Clarity account!
2. It’s easy to install
Speaking of installation, Clarity gives users multiple options to install the tracking code onto your website, including manual installation or installation via third-party platforms like Google Tag Manager. The majority of our clients use Google Tag Manager, and the installation process takes about five minutes to complete. You can’t beat that!
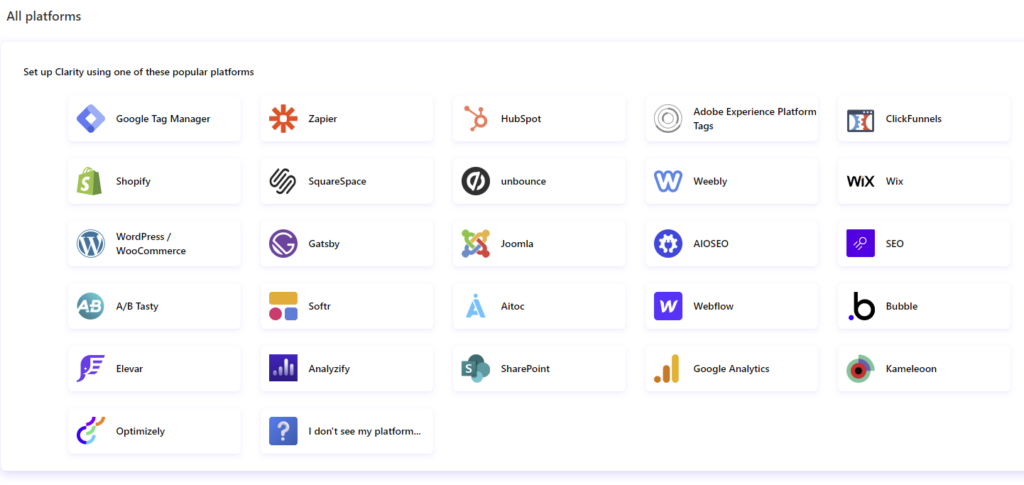
Update for 2024: Microsoft Clarity integrates with several popular platforms (some of these were available in 2022 as well), but they have expanded to include:
3. Microsoft Clarity integrates with Google Analytics
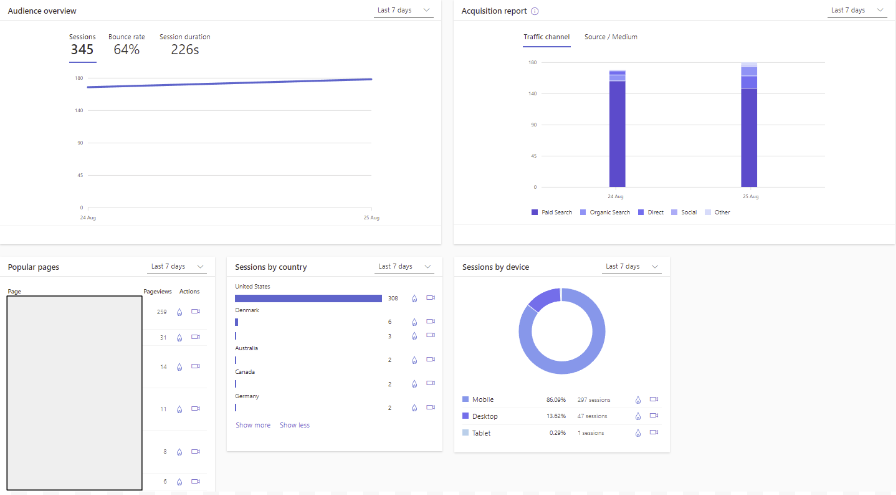
Not only is Clarity easy to set up, but it can also integrate with Google Analytics (either via UA or GA4) to pull additional metrics into your dashboard like popular pages, sessions by country, source/medium, and more. Whether you connect with UA or GA4, the metrics pulled in are essentially the same - UA just includes Bounce Rate in addition to Sessions and Session Duration.
Universal Analytics Metrics in Clarity:
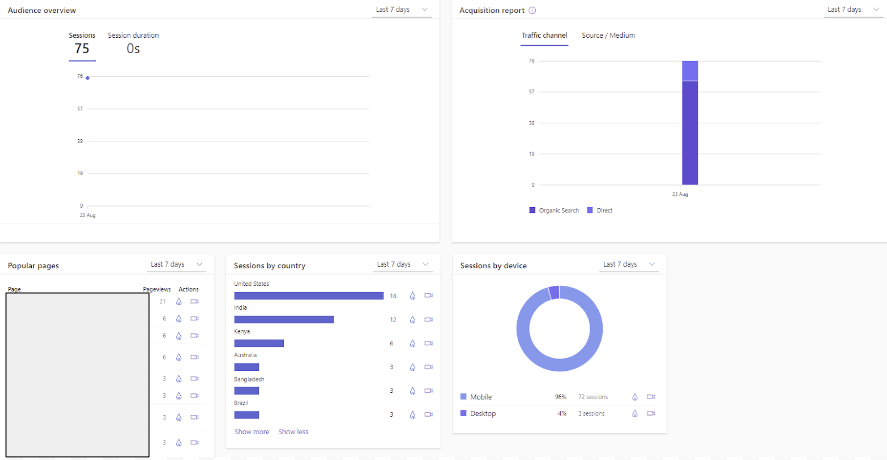
GA4 Metrics in Clarity:
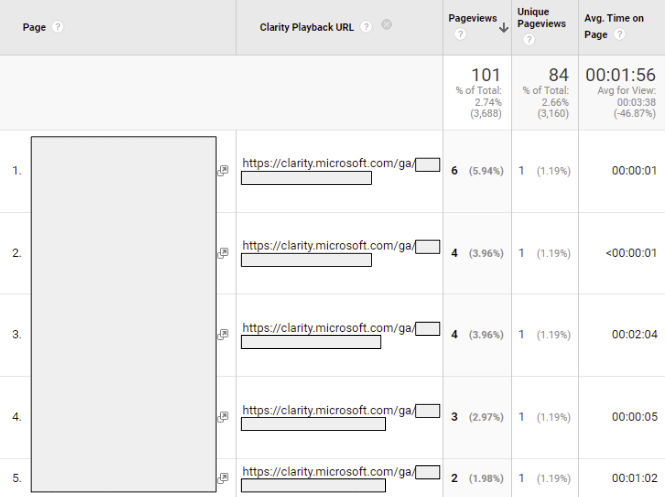
Within Universal Analytics, the custom dimension “Clarity Playback URL” pulls in the links to session recordings, so you can watch recordings for specific landing pages, exit pages, and more right from GA.
In GA4, "Clarity Playback URL" should also be created as a custom dimension which can be set from the "Configure" tab.
Update for 2024: Microsoft Clarity still gives you the option to integrate with UA, but UA stopped collecting data almost a year ago and will be permanently deleted on July 1st so we wouldn't recommend setting up that integration.
4. It's GDPR compliant
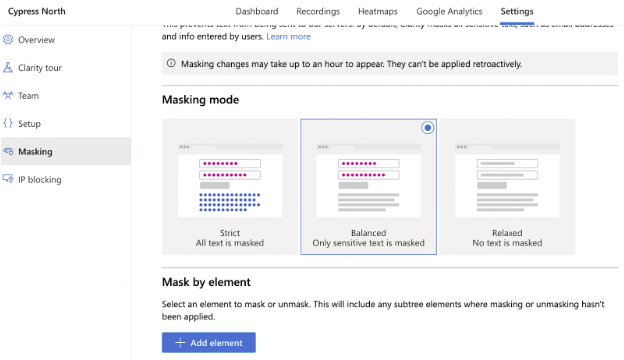
With all this data being stored, is Clarity GDPR-complaint? The answer is yes! According to Microsoft’s Frequently Asked Privacy Questions, Clarity is GDPR-compliant and processes data in compliance with the CCPA. All data is stored in the Microsoft Azure Cloud service, and project data is only stored for three months before the project owner can no longer access it. Project owners also have the ability to mask certain elements and text (by default Clarity masks sensitive text like emails) in Settings to ensure confidential information isn’t being collected.
5. Superior Filtering Capabilities
Clarity allows you to easily filter recordings and heatmap data by device type, country, traffic source, session duration, page path, and more. Users can even create custom filters to track elements more specific to their website. Segments can also be created to save a group of commonly used filters for easy access.

Some filters I have found helpful in my travels include:
- “Entered Text = Yes” checkbox to see users who have interacted with forms
- Country filter to see if/how users from different countries interacted with the content differently
- “Medium = organic” checkbox to look at user engagement from visitors arriving to our sites organically
Update for 2024: Microsoft Clarity has expanded its filtering capabilities pretty substantially. Device type, country, traffic source, etc. are all still options - along with some new filters like:
- Day of the week = a dropdown with checkboxes to filter by one day of the week or to make multiple selections.
- State and city = dropdown filters that allow the user to view data for a specific state and/or city. A country must be defined first, then a state before narrowing down further to city.
- Page scroll depth range = watch recordings or view heatmaps based on the minimum and/or maximum amount scrolled on a page. This can be helpful if you want to see how users interact with a specific element towards the bottom of a page, or in the footer.
- Smart events = these are what Clarity calls key user actions, and Clarity will automatically define these for you, or you can create your own smart events. Automatically created events can be edited later.
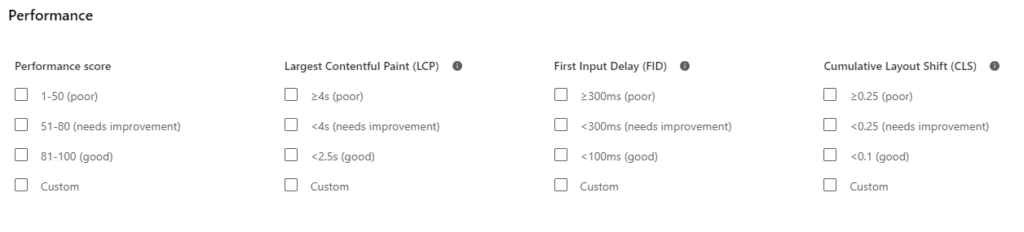
You can also filter by page performance score and the Core Web Vitals: Last Contentful Paint (LCP), Cumulative Layout Shift (CLS), and First Input Delay (FID). Google replaced FID with INP (Interaction to Next Paint) in March of 2024, but it looks like Clarity hasn't updated that yet at the time of this writing.
6. Useful UX metrics
Microsoft Clarity has a lot of different user engagement metrics which can be helpful to identify where users on the site might be getting stuck, and what elements they interacted with. Some of these include:
- Rage Clicks - excessively and rapidly clicking/tapping on an element in an attempt to get it to do something. This can indicate user frustration and may be a sign that buttons or other elements are broken.
- Dead Clicks - clicking/tapping on an element that is not interactive. This can indicate that the user expects the element to be interactive in some way.
- Quick Backs - user navigated back to the previous page as soon as they arrived on the current page. This can indicate that the user was expecting a different result (anchor text, title may be misleading, etc.)
- Selected Text - the user selected text on the page, which may indicate that that text resonates with them, answered a question, or they are copy/pasting
All of these metrics can be used to make UX improvements to the site, like editing anchor text to more accurately describe a link, fixing broken elements, or reworking elements that look clickable.
7. Helpful support team
In our experience, we’ve found the Clarity support team to be very helpful and responsive to any troubleshooting issues we’ve run across. For example, we’ve had issues getting Google Analytics data (specifically UA data) to populate in the Clarity dashboard. After being unable to find helpful support documentation online (see cons), we reached out to the support team via email and received a prompt response to resolve our issue.
8. Live Demo
In case you’re not sure if Microsoft Clarity is for you, they offer a live demo you can use to explore the platform and compare it against any existing heatmapping or session recording tools you may be using. The live demo gets its data from the Microsoft Clarity website.
9. Clarity Live Extension Plugin
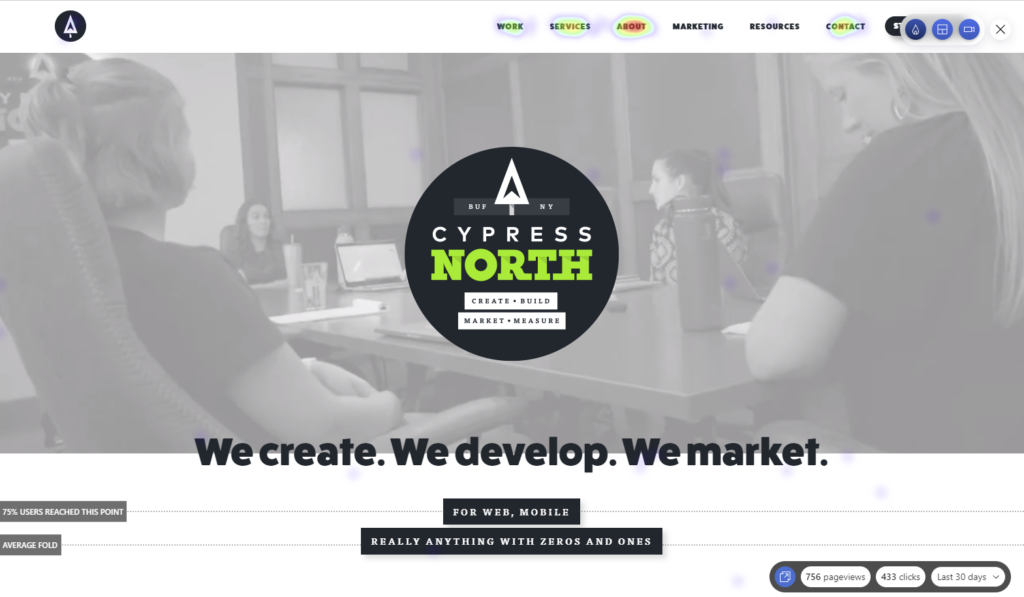
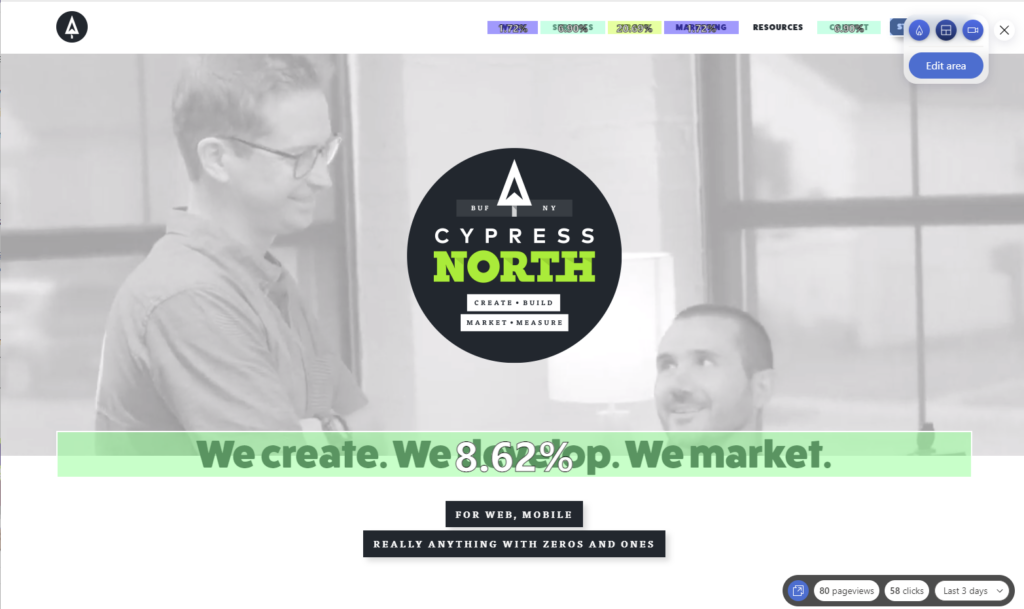
The Clarity Live Extension plugin is a Chrome plugin that allows you to view heatmaps, area maps, and session recordings for any page on your website where Clarity is installed. This plugin is a really cool way to get some quick insights on engagement and view metrics without having to flip back and forth to another window.
Screenshot of Heatmaps:
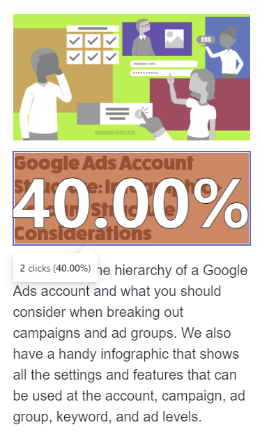
Screenshot of Area Maps:
The area map is even interactive, you can hover over specific elements to see how many users clicked.
Screenshot of Session Recordings:
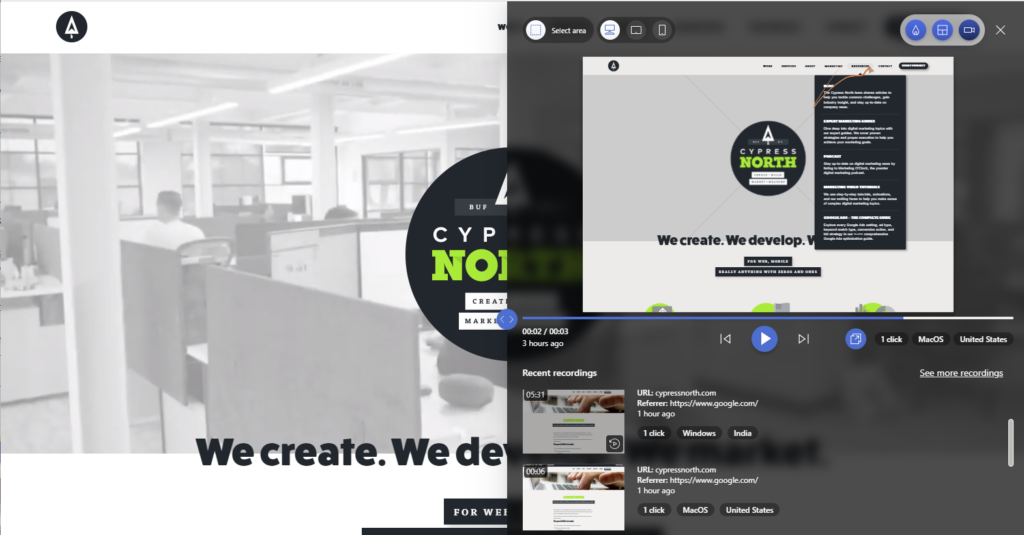
The only caveat - if you shrink your screen down to mobile view using Google Developer Tools, the plugin doesn’t provide mobile metrics. You’ll have to login to Clarity to see that data!
10. Google Optimize Integration
Update for 2024: Google Optimize was deprecated on September 30, 2023 so this feature no longer exists in Microsoft Clarity unfortunately.
11. Industry benchmarks
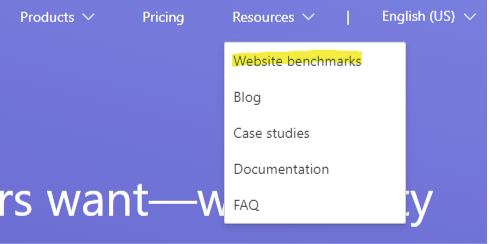
Microsoft Clarity’s industry benchmarks are still in beta, but this interactive report lets users view benchmarks across different industries for metrics like page speed, browser data, traffic channels, and more. These benchmarks can be found by navigating to clarity.microsoft.com, then selecting “Website benchmarks” underneath Resources.
Available industry categories at the time of publication include:
- Arts & Entertainment
- Business & Industry
- Technology
- Games
- Health & Fitness
- Home & Garden
- News
- Travel & Recreation
- Reference
- Science
- Shopping
- People & Society
- Sports
- Kids & Teens
Once you’ve selected a category, you can see data like the user frustration metrics in the screenshot below. These were for the Shopping category:
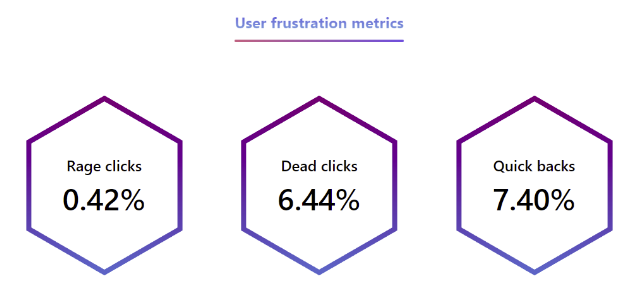
Or use the comparison tool to compare data between two industries. Since this report is currently in beta, data is currently being collected from user sessions in the United States and Japan, but will expand globally. The data is updated daily.
Update for 2024: This report is actually still in beta, and Clarity says they are still only collecting user data from the United States and Japan so all the information above still applies.
Microsoft Clarity Features I'm Loving in 2024 (and One I'm on the Fence About)
Most of the information shared back in 2022 is still relevant today, but the platform has grown to include some awesome features I'm currently loving. These include:
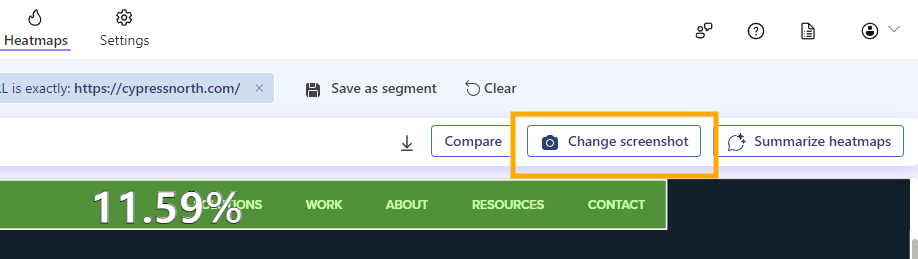
12. The ability to change screenshots in heatmaps
Sometimes pages don’t render properly within the heatmapping tool, so Microsoft Clarity allows you to change the screenshot shown so you can get a better idea of what elements are being clicked. To change the screenshot, you can click on the “Change screenshot” button in the upper right.
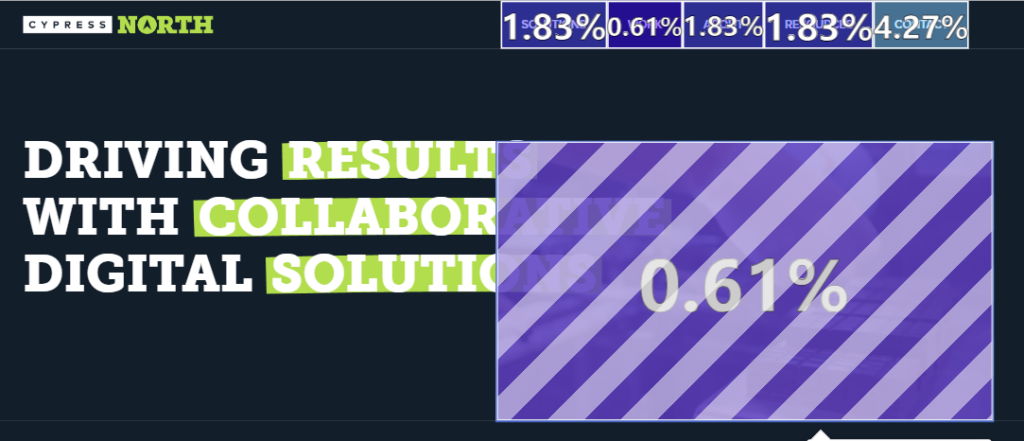
13. Editable area maps
When you use the “Area” heatmap, Microsoft Clarity allows you to change what areas you are viewing click data for. I like that this feature gives me the power to look more granularly at specific elements on the page.
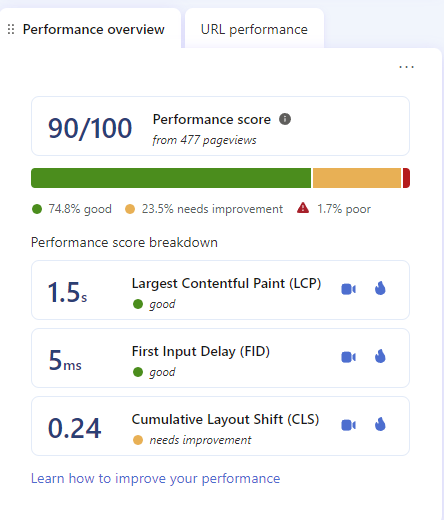
14. The performance overview
This section includes a weighted performance score based on the LCP, FID, and CLS metrics. Core Web Vitals are controversial in the SEO world, and we wouldn’t recommend hyper-fixating on these numbers - but if a page is very slow or has an aggressive layout shift this feature makes that easy to spot.
15. AI-generated heatmap and recording summaries
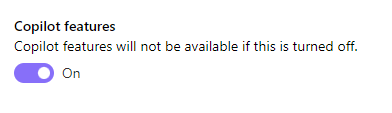
I don't typically use this feature so I can't speak to its accuracy, but I had to at least mention that Microsoft Clarity has added AI to the platform via Copilot. You can use Copilot to summarize heatmaps and recordings, or discover trends within your Google Analytics data by asking it questions. This feature could be helpful if you aren't sure where to start, but I would absolutely validate everything Copilot is generating to make sure its accurate. If you don't want to use AI to analyze your data, you can turn Copilot features off in settings:
Some Microsoft Clarity Cons
Now that we’ve listed out some of our favorite features, here are some areas where we’ve found room for improvement.
1. Lack of detailed documentation for GA integration troubleshooting
While Microsoft does provide some helpful online instructions to get started with Clarity, when we first started the set-up process the documentation did not contain detailed information on setting up Google Analytics (Universal or GA4). At the time of publication, it looks like the set-up instructions did improve substantially - but there still isn’t a lot of information on troubleshooting or common errors. A video to walk users through the set-up process would be really helpful here, along with a troubleshooting section.
Update for 2024: It looks like the documentation for Google Analytics has improved since 2022, and there is more information here on how to get started and make the most of your Google Analytics integration.
2. No “exclude” ability on filters at the time of publication
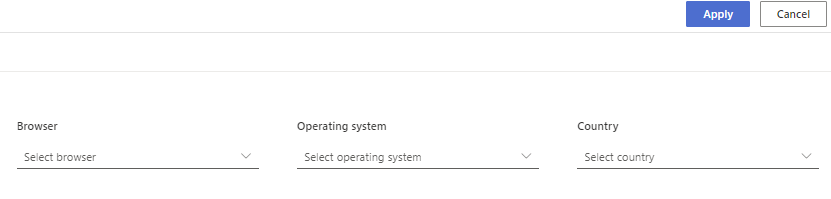
Let’s say you want to view heatmap data for all countries outside of North America, so you want to exclude the United States, Mexico, and Canada. In order to do this currently, you would need to select all countries manually using checkboxes (there is no “Select All'' button), except for those three countries. This takes a substantial amount of time, it would be much easier to include an “exclude/include” feature in front of the dropdown.
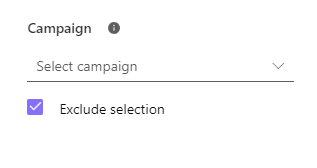
This is no longer an issue in 2024: Microsoft Clarity added an "Exclude selection" option since this post was first published. This is no longer a con for me!
3. Login confusion if using a shared login
Admittedly this issue may be somewhat self-inflicted, but like many agencies we have one dedicated email account to access shared marketing tools and to own our Google Analytics account. We use this shared email account to login to Microsoft Clarity, but have found that if a user doesn’t log into Microsoft via the correct path, they won’t be able to see any of the projects we have access to.
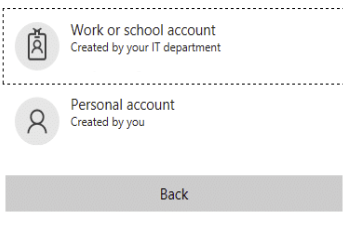
This can easily be solved by logging out and logging back in, but if a client sends us access and the invitation is accepted via the wrong sign-on method (say Google), the project will not be accessible if someone logs in via Microsoft. If the client revokes the invitation, then sends access again, the project invite can then be re-accepted and will be accessible via the preferred sign-on option.
This is still a con for us in 2024. When I use the Google sign-on method for our email address, I am presented with only a handful of the projects in my account. When I sign-on using the Microsoft method for the same email I can then access the rest of my projects. We now all know to login with Microsoft (our chosen sign-on method) for the most part, but it’s still confusing to remember which projects are accessible via which sign-on method.
Overall, I am still a big Microsoft Clarity fan. The pros far outweigh the cons, and the tool contains so many cool features and plugins - especially considering that it’s free. Microsoft always seems to be adding something new, and I’m excited to see the tool continue to evolve in the future.
If you need assistance with web analytics and tracking, don’t hesitate to reach out! Get in touch with us or continue reading to discover more helpful resources from Cypress North’s resident data nerds.
Meet the Author

Kathleen Hagelberger
Kathleen is our Director of Organic. She joined Cypress North in July 2019 and works out of our Buffalo office. Known by coworkers and clients alike as Kbergs, Kathleen is an SEO specialist who brings more than four years of experience to our digital marketing team. Some of her daily responsibilities include monitoring organic traffic for clients and reporting on what she finds, putting together site plans, helping with new site launches, project management, and other SEO projects. She also makes occasional guest host appearances on our Marketing O’Clock podcast.
Before joining Cypress North, Kathleen gained professional experience through internships with Genesee Regional Bank and TJX Companies, Inc. She has earned her Google UX Design certificate, Google Analytics 4 certification, and HubSpot Content Marketing certification.
Originally from Attica, Kathleen graduated from the Rochester Institute of Technology with bachelor's degrees in new media marketing and management information systems.
Outside of work, Kathleen is on the volunteer committee for Erie County's Walk to End Alzheimer's chapter. She also serves as the Vice President of Public Relations for one of the Buffalo chapters of Toastmasters.
In her downtime, Kathleen enjoys taking dance classes like tap and jazz and fitness classes in general. She also likes going to the beach, trying new restaurants, reading, watching 80s movies, and Marie Kondo-ing her apartment.
Related Resources

How to Get Started with GA4: A Step-by-Step Guide
Need help setting up GA4 for your company or client’s website? Look no further! This post provides a step-by-step process for creating GA4 properties and best practices to make sure necessary events are tracked and the data flowing into GA4 are accurate.

What to Include in a PPC Dashboard
Learn What Metrics to Include in PPC Reports. Then, Download Our Free Data Studio Dashboard Template! Let’s be real, pay per click advertising is all about data. What campaigns are bringing in the most revenue? What landing pages are converting […]
Google Data Studio Advanced Techniques: Blended Data, and Custom Metrics
Data Studio Advanced Techniques: Introduction If you’re running any digital marketing campaigns, then you’re probably tracking their performance and the impact they have on the sales and/or marketing goals of your company as a whole. Most often, performance is tracked […]

Taking Ad-vantage of Google Analytics New Conversion Probability Report
Not all site visitors are created equal. Some folks might come to your site because their mother sent them a link to something "interesting" (eye-roll Mom, I'm so not into that), while others might be doing some initial research on […]
Device Targeting With Target CPA Bidding In Google Ads
All device targeting is not created equal. If your Google Ads campaign uses target CPA bidding and you're prioritizing conversions from a certain device, we're willing to bet you're doing it wrong. We rarely see this stipulation highlighted when we research […]