6 Google Ads Custom Columns to Help Uncover More Data

You may already know you can create custom columns in the Google Ads online interface. But, if you're anything like me, you may not always think about how you can leverage custom columns to surface essential Google Ads performance metrics, saving you time and a lot of clicks.
Why Use Custom Columns?
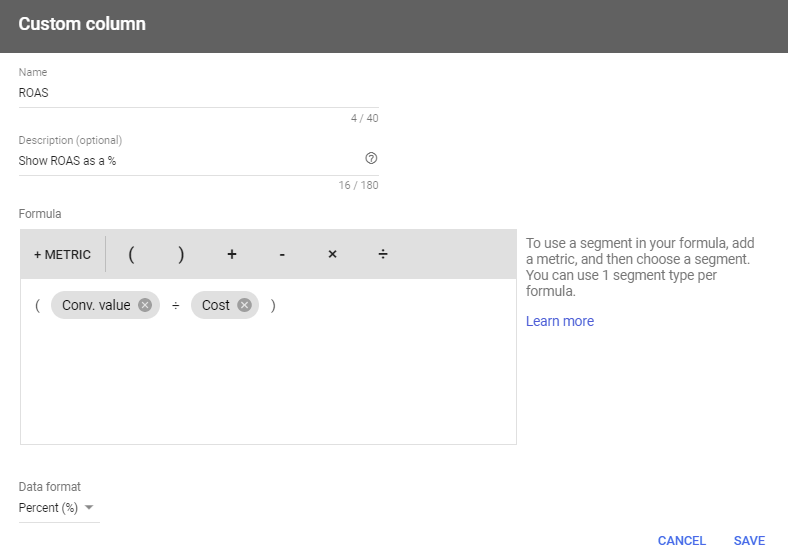
I began using custom columns to make my life easier while I was sharing my screen with clients. Frankly, was sick of explaining that the Conversion Value/Cost column was Return on Ad Spend (ROAS). So, I made a column that was a % called "ROAS".
That was just the beginning.
From there, I began to explore other options to showcase KPIs in our campaigns. I highly recommend testing these out and adding your own custom columns to make it easier to see campaign performance at a glance. It'll save you a lot of time during analysis and (if you love screen sharing as much as I do) a lot of energy explaining what different columns are to clients.
Optional Segmentation
This is where the true value lies within Custom Columns. Instead of relying on segmentation of the entire data set in the web editor, you can bring that segmentation into the column specifically. This means that you can compare performance across device types (like mobile vs. desktop) or networks (like Google Search or Search Partners). Here are all the available options for Custom Columns:
- Conversions
- Conversion source
- Google Analytics
- Calls from Website
- Google Play
- Import from clicks
- iOS app install
- Mobile app
- Phone number clicks
- Website
- Store visits
- Conversion action
- Transactions (All Web Site Data)
- Android installs (all other apps)
- Conversion source
- Device
- Computers
- Mobile Phones
- Tablets
- TV screens
- Network (with search partners)
- Google search
- Search Partners
- Google Display Network
- Top vs. Other
- Google search: Top
- Google search: Other
- Google Display Network
- Search Partners: Top
- Search Partners
So, you can juxtapose this segmentation on one (or any, or all) data points that you pull into a column, unlike the simple segmentation tool in Google Ads that will filter all of the data.
Additionally, you can turn the column into one of the following types:
- Number
- Percent
- Money
Allright, let's get to it.
Sample Google Ads Custom Columns
True ROAS
As mentioned above, for some reason, Google Ads does not have a ROAS column that you can fire up out of the gate. Instead of showing the decimal return on spend with the Conversion Value/Cost column, you can show ROAS as a percentage with the following column:
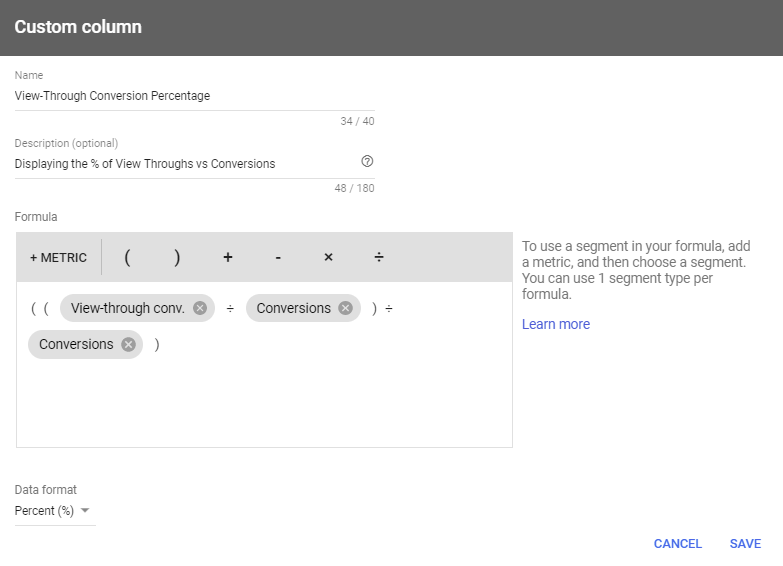
View Through Percentage
When assessing how display campaigns are running, I always like to consider the view-through conversions as well. However, with that being an entirely different column, I wanted to get a quick percentage of view-throughs compared to regular conversions. This is directionally helpful to quickly show what campaigns or ads are really driving conversions without the click. If there are 5 view through conversions to 1 regular conversion, this percentage will be 500% and if the other way around (1 view through to 5 regular conversions) then the number will be 20%.
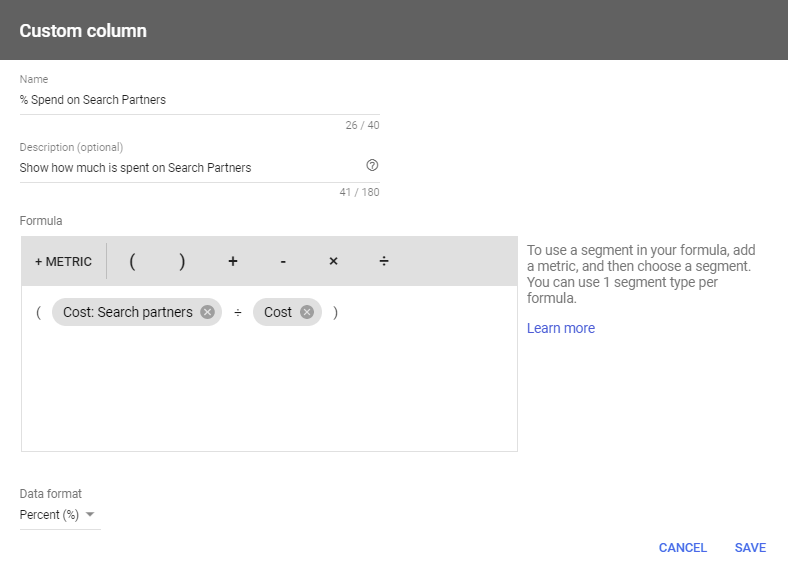
Percentage Spend on Search Partners
Search Partners are a hot topic, and when search ads are enabled to run on Search Partner sites, you may end up putting more of your budget toward properties that aren't paying off. With this equation, you'll be able to quickly see how much of a campaign/ad group budget is going towards Search Partners. For this, we'll need to start with the segmentation of the Search Partners cost divided it by total cost:
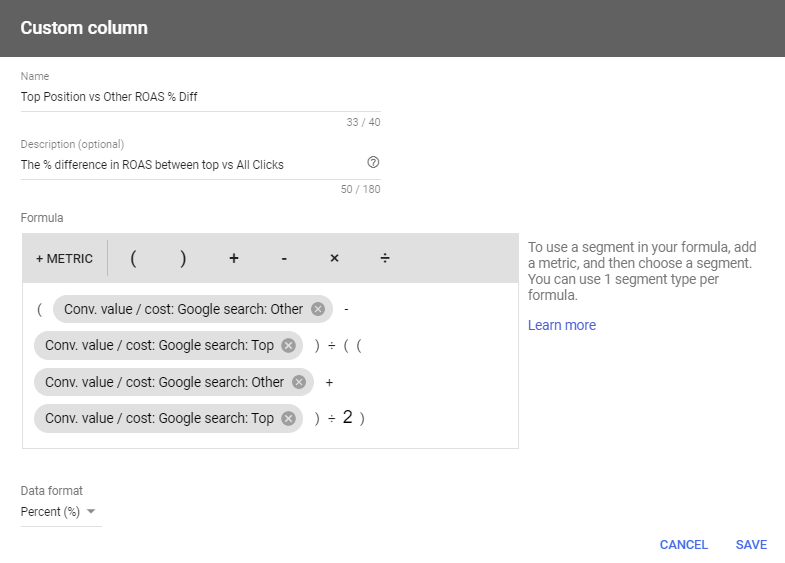
Top ROAS vs Other ROAS
If you wanted to quickly compare ROAS (or CPA) from clicks in the top position vs the other positions, this can help show the difference (as a percentage) of top vs other clicks. This can help dictate what location works best for return.
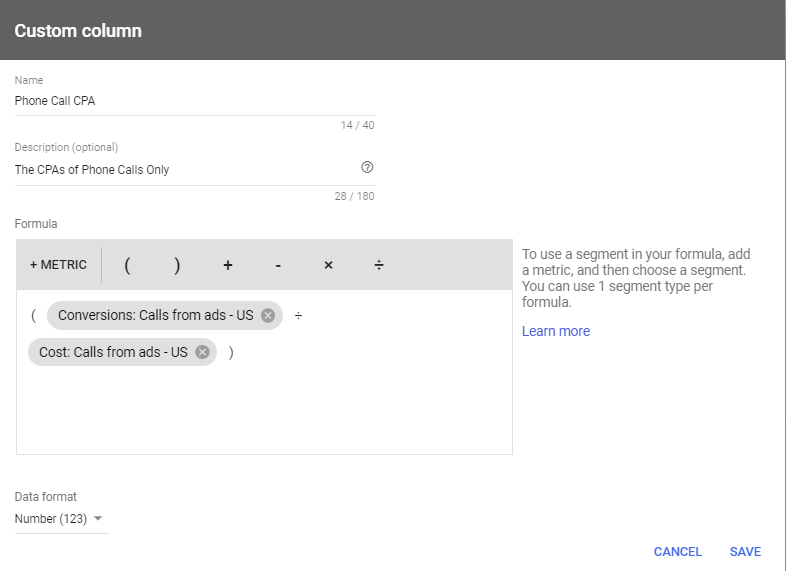
CPA by Conversion Type
If you have different conversions or all-conversions that you report on, setting up as a column is a simple way to view stats without needing the conversion type segmentation across all data. Simply toss in a metric you want to see (like CPA in this case) and see it in it's own column next to all your other data.
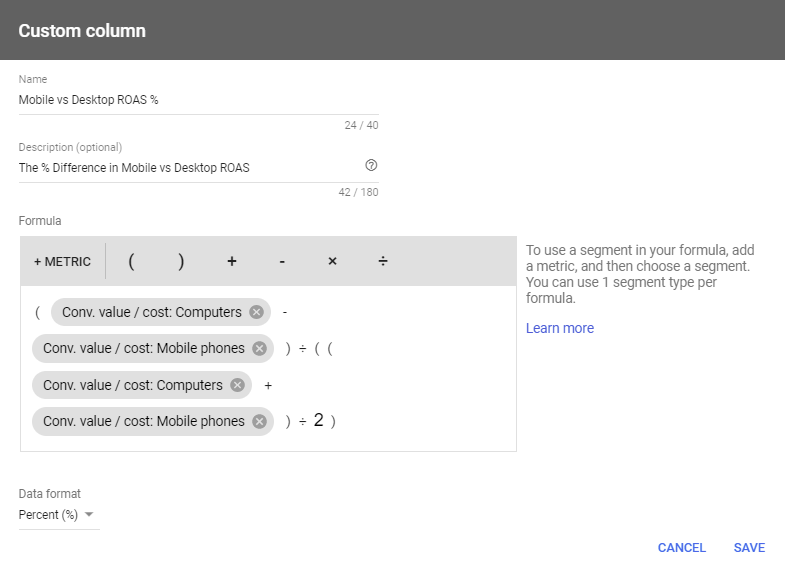
CPA Differential (Mobile vs Computers)
This is one of my favorites for any campaigns that mix device types. Quickly compare how much more efficient one device type is compared to another to help make informed decisions with device-based bid adjustments. Switch over to CPA if you aren't e-comm and you can use this for any campaign that targets multiple devices.
While those are only six examples, the key is to figure out what data would be most valuable when doing your daily maintenance and then work backward to create the equation that you need. There are a good number of options to segment data, but you can't do everything with Custom Columns and may need to create your own Data Studio or Custom Reports. If you haven't played around with Custom Columns yet, you now have 6 ideas to work off of and improve on!
4 Comments
Leave a Reply
Meet the Author

Greg Finn
Greg is the Head of Performance and Innovation for Cypress North's digital marketing team and one of the founders of our agency. In 2010, he and Matt Mombrea started Cypress North in Buffalo. Greg oversaw the opening of our second office in 2022, located in his hometown of Rochester.
As Head of Performance and Innovation, Greg co-manages our digital marketing department and works closely with our team to ensure all our clients achieve the best possible results. He is always looking for ways to test new digital marketing techniques and technology, and oversees all teaching and training efforts to ensure our agency stays ahead of the curve.
Greg is also a co-host of our weekly Marketing O'Clock podcast, where he and the team provide updates, insights, and hot takes on the latest SEO, PPC, and social media marketing news. In addition to weekly news shows, Greg hosts our Marketing O'Torial digital marketing tutorials and often co-hosts bonus Marketing O'Talk episodes that bring together panels of digital marketing experts.
With nearly two decades of experience, Greg is a known and trusted voice in the digital marketing community. He’s a contributor for Search Engine Land, a member of the Search Marketing Expo (SMX) programming team, and has been a featured speaker at some of the largest search engine conferences, including SMX, eSummit, and Pubcon.
When he’s not working or staying updated on the latest trends, Greg enjoys watching his kids play sports and coaching their soccer team. He’s been named the runner-up “Greg of the Year” on Marketing O’Clock’s annual Clockscars Awards four years in a row. While the coveted award has evaded him for many years, Keanu Reeves has not. Greg once saw him at Gabriel's Gate tavern in Buffalo (and noted he was very tall.)
Related Resources
10 Digital Marketing Hot Takes from SMX Advanced
If you ever need a hot take, put a few hundred digital marketers in one place at the same time. We know there's a lot of advice and opinions out there relating to our industry. So when we were at […]
Google Updates Ad Scheduling Budget Pacing: What it Means for Advertisers
If you use ad scheduling in Google, changes are coming to daily budget pacing. Learn more about the updates and what you can do to prepare.

Is Your Digital Marketing Strategy Putting You at Risk? Understanding CCPA’s New Legal Precedent
Capital One’s privacy lawsuit highlights growing risks for marketers relying on standard tracking technologies. Here's what you need to know.
Google Marketing Live 2025: The Biggest Changes Coming to Google Ads & How They'll Impact You
A lot of news came out of GML 2025, including tons of AI features. Here are the biggest Google Ads announcements and how they could impact you.

Using BigQuery to Overcome GA4 Data Retention Limits
Keep your GA4 data forever with BigQuery. Learn how to set up BigQuery to start storing raw GA4 data before it's gone for good.
AI Max for Google Ads: My Takes as a Digital Marketer
Google Ads just announced its new AI Max feature. Greg Finn breaks down the good vs. the bad and gives his honest opinions on the update.

How to Control Branded Spend in Google Ads
We all know branded spend can sneak up on you. Learn different ways you can control your branded spend in Google Ads.
Google Ads Brand Lists: How to Use Brand Inclusions & Exclusions in Search & PMax
Showing ads for your brand name may be wasting money you could use elsewhere. Learn how to use brand lists, inclusions, and exclusions to control your branded searches.
Google Ads Demand Gen Campaigns: From Disappointment to Improvement
Learn how recent updates to Demand Gen in Google Ads can improve visibility and help advertisers make better use of these campaigns.

Are We in a Golden Era of Google Ads?
Is real change coming to Google Ads? Recent changes indicate the team is taking feedback seriously and putting more of a focus on advertisers.
What AI-Driven Search Means for the Future of Publishers
Independent ad-supported publishers face a tough reality with Google’s AI Overviews and zero-click searches. Learn why Google traffic may not be the solution for long-term success.
Why I Changed My Mind About Using PMax
Google is constantly making improvements to Performance Max. Here’s why the former #1 PMax hater changed his mind and now recommends all marketers try this campaign type.
Improve Daily Budget Monitoring in Google Ads with This Simple Script
Managing Google Ads budgets isn’t easy. Here’s a free script you can use to make it less time-consuming and stressful.
Google Launches AI Mode: What it Means for the Future of Search
Google’s new AI Mode marks a major shift in its search strategy. Here’s how we expect it to transform the user experience and future of search.
How Much Are You Really Spending on Your Brand?
Branded spend can sneak up on you when you least expect it. Learn why you should be checking regularly and how to do it effectively.

Multiple Auctions for Different Ad Locations: What Advertisers Need to Know
Google Ads runs multiple auctions for different ad locations. Learn how this impacts Ad Rank, the changes to bidding, and why communication from Google remains unclear.
Google’s RSA Headlines & Sitelinks Update Makes Zero Sense
Google is starting to serve RSA headlines as sitelinks. Here’s what advertisers need to know and why this change makes no sense.

Google Ads Brand Guidelines: Simplifying Advertising and Reducing Fraud
The upcoming changes to brand guidelines will simplify advertising, reduce fraud, and improve account management. See how this may affect you as an advertiser.

The End of Navigation-Less Landing Pages in Google Ads
Google Ads now emphasizes the importance of navigation on landing pages. Learn why this change impacts your campaigns and how to adapt for better performance.

How To Replicate Video Action Campaigns with New Demand Gen Controls
See how Google’s new Demand Gen controls allow you to replicate Video Action Campaigns with channel-specific targeting, making the transition smoother and more effective for advertisers.
Hi Greg,
I came across your post hitting trying to resolve a problem running campaign cost reports. If I run the report strictly on campaign and cost I get one figure. If I add any Geo specific fields:
1 Most specific location target (Geographic)
2 City (Geographic)
3 Metro area (Geographic)
4 Region (Geographic)
The cost reported is significantly lower?
Both reports use the same date range, just adding Geo fields to the report. no other filtering?
Any ideas?
Hrm, haven't noticed that Carl (though we don't have many local paid search clients). For Geos, Google took away som good reporting last year, and they may have not updated. You may have to now use the custom location report: https://searchengineland.com/whats-changed-in-google-ads-locations-reporting-and-why-you-need-a-custom-report-341229
Thank you for the quick reply Greg I will try that! Take care, stay safe and have good weekend.
Hi Greg,
Great post, thank you! Quick question, is it possible to bring in/select a Custom Column within "Reports". Although I have created a few unique Custom Columns, after clicking on Reports I unfortunately have not been able to find them within the filters of the Conversion Category, Conversion Action Name, or Conversion Source.