How To Properly Perform Statistically Relevant Split PPC Ad Testing


The crux of a solid paid search campaign indubitably is the ad copy that drives the user to make the click. When auditing paid search campaigns from other companies, it is always a shock to see the (lack of) ad testing that is used. An A/B split test is an extremely simple way to test a baseline ad against a new iteration, and use simple statistics and confidence testing to prove a theory with an exact confidence. This is a crucial element that we leverage with client recommendations and tactics -- as facts and science never lie. Want to see how easy it can be to calculate statistical relevancy? Follow along in the steps below.
1. Formulate a Test & Implement
In order to test, we'll need two different versions of an ad to test. More importantly, we need to identify what the success metric is. Maybe it is number of purchases, maybe it's number of clicks. For this example, let's assume that our success goal is a "sign-up" and we are testing the ad copy effects on visitors.We will start with one "championship" ad that is currently active that we'll call "Ad A". The variation will be "Ad B" with all elements the same as "Ad A", except for the ad headline.
2. Ensure You Are Collecting Accurate Data
As any statistician will tell you, the sample that you are using is key to cut down sample error. The goal is to pull our data from an unbiased sample that is representative of the population.
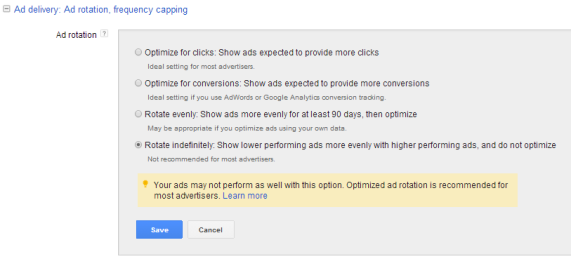
Ad Rotation In Google:
The way that AdWords is set up out of the gate won't serve us in the way we need, as it will try to optimize for clicks. We would rather use a systematic sampling model that will provide us equal results in our test. We recommend using "Rotate indefinitely" for your test within the campaign settings tab in AdWords:
Ad Rotation In Bing:
Like Google, Bing also automatically sets ads to show more often based on clicks. To turn this off you'll need to change each Ad Group by hopping into the Ad Group settings. You'll see the Ad Rotation option:

3. Collect Data
Ahhh, the easy part. Sit back and watch the impressions, clicks and conversions pile up. The size you'll need will depend on how accurate you'd like the test to be. Obviously the more data the better and you can see some tables on error percentages based on differing sample sizes. If you want to project a timeframe required to hit your ideal test sample size, Visual Website Optimizer has a nice free tool to help.
4. Analyze Data
If you aren't a savvy statistician, don't fret. There are plenty of calculators that can help display the data you require. I personally use Thumbtack's free A/B Test calculator for quick comparison. You'll want to insert your number of trials (visitors in this case) to the successes (sign-ups). You can adjust the confidence level if you'd like, but a 95% confidence interval is standard in stats.
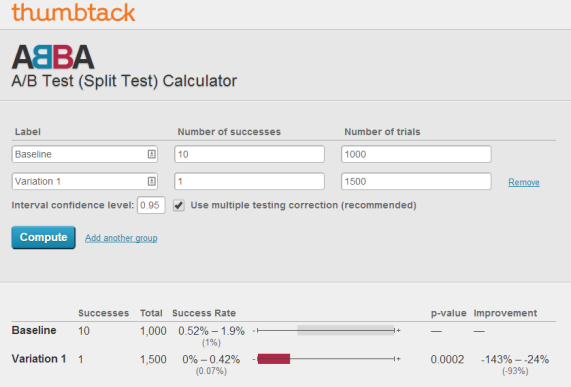
The p-value displays our confidence that the improvement is in fact statistically relevant. The lower the p-value, the higher the confidence. We'd like to have a p-value of between 0.05 and 0.01 for "statistical significance." For the example above we can see a very low p-value that means the tests have reached statistical significance. Seeing that this is statistically relevant, we can then look at the results and the estimated improvement. This test shows that the variation would likely cause a decreased success rate that would actually be anywhere from a 24% - 143% decrease in conversions (with the average conversion decrease of 93%).
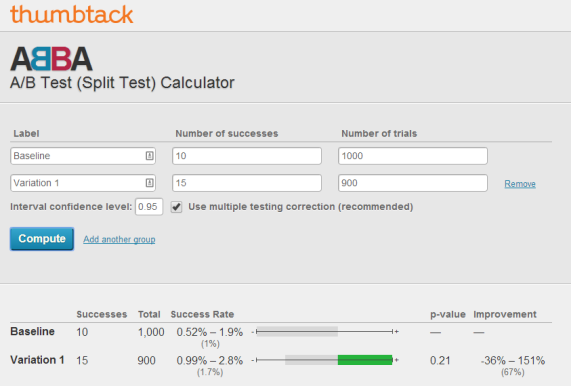
This example however shows that our test is currently not statistically significant as our p-value is a whopping 0.21. There is nothing that can be statistically recommended from this test. So from the two examples, we would strongly recommend keeping the Baseline ad in Test 1 as visitors were 93% more likely to convert, while we would not have any recommendations for the second test. If the success ratios held firm on the second test continue we'd need a little more than 2.5x the sample size to be statistically significant.
And that's it! Not only should this help you make more informed decisions for yourself and clients, but it also an easy method to back-up your work and tactics with science in case a client doesn't agree with your strategy..
Like this? Want more great info? Be sure to follow us on Google+:
Keep up with us on Twitter: Follow @cypressnorth
or of course Instagram and Facebook.
Meet the Author

Greg Finn
Greg is the Head of Performance and Innovation for Cypress North's digital marketing team and one of the founders of our agency. In 2010, he and Matt Mombrea started Cypress North in Buffalo. Greg oversaw the opening of our second office in 2022, located in his hometown of Rochester.
As Head of Performance and Innovation, Greg co-manages our digital marketing department and works closely with our team to ensure all our clients achieve the best possible results. He is always looking for ways to test new digital marketing techniques and technology, and oversees all teaching and training efforts to ensure our agency stays ahead of the curve.
Greg is also a co-host of our weekly Marketing O'Clock podcast, where he and the team provide updates, insights, and hot takes on the latest SEO, PPC, and social media marketing news. In addition to weekly news shows, Greg hosts our Marketing O'Torial digital marketing tutorials and often co-hosts bonus Marketing O'Talk episodes that bring together panels of digital marketing experts.
With nearly two decades of experience, Greg is a known and trusted voice in the digital marketing community. He’s a contributor for Search Engine Land, a member of the Search Marketing Expo (SMX) programming team, and has been a featured speaker at some of the largest search engine conferences, including SMX, eSummit, and Pubcon.
When he’s not working or staying updated on the latest trends, Greg enjoys watching his kids play sports and coaching their soccer team. He’s been named the runner-up “Greg of the Year” on Marketing O’Clock’s annual Clockscars Awards four years in a row. While the coveted award has evaded him for many years, Keanu Reeves has not. Greg once saw him at Gabriel's Gate tavern in Buffalo (and noted he was very tall.)
Related Resources
Google Updates Ad Scheduling Budget Pacing: What it Means for Advertisers
If you use ad scheduling in Google, changes are coming to daily budget pacing. Learn more about the updates and what you can do to prepare.

5 Methods to View a Page as Googlebot
Can search engine crawlers access your content? If you’re not sure, check out these five methods to view your pages as Googlebot and other crawlers.
Google Marketing Live 2025: The Biggest Changes Coming to Google Ads & How They'll Impact You
A lot of news came out of GML 2025, including tons of AI features. Here are the biggest Google Ads announcements and how they could impact you.
AI Max for Google Ads: My Takes as a Digital Marketer
Google Ads just announced its new AI Max feature. Greg Finn breaks down the good vs. the bad and gives his honest opinions on the update.
How to Control Branded Spend in Google Ads
We all know branded spend can sneak up on you. Learn different ways you can control your branded spend in Google Ads.
Google Ads Brand Lists: How to Use Brand Inclusions & Exclusions in Search & PMax
Showing ads for your brand name may be wasting money you could use elsewhere. Learn how to use brand lists, inclusions, and exclusions to control your branded searches.
Google Ads Demand Gen Campaigns: From Disappointment to Improvement
Learn how recent updates to Demand Gen in Google Ads can improve visibility and help advertisers make better use of these campaigns.

3 Options for Multilingual Website Translation
Managing multilingual web content is challenging, and there are plenty of options available. Learn more about the solutions and how to find the right one for you.

Are We in a Golden Era of Google Ads?
Is real change coming to Google Ads? Recent changes indicate the team is taking feedback seriously and putting more of a focus on advertisers.
What AI-Driven Search Means for the Future of Publishers
Independent ad-supported publishers face a tough reality with Google’s AI Overviews and zero-click searches. Learn why Google traffic may not be the solution for long-term success.
Why I Changed My Mind About Using PMax
Google is constantly making improvements to Performance Max. Here’s why the former #1 PMax hater changed his mind and now recommends all marketers try this campaign type.

Improve Daily Budget Monitoring in Google Ads with This Simple Script
Managing Google Ads budgets isn’t easy. Here’s a free script you can use to make it less time-consuming and stressful.
Google Launches AI Mode: What it Means for the Future of Search
Google’s new AI Mode marks a major shift in its search strategy. Here’s how we expect it to transform the user experience and future of search.
How Much Are You Really Spending on Your Brand?
Branded spend can sneak up on you when you least expect it. Learn why you should be checking regularly and how to do it effectively.

Multiple Auctions for Different Ad Locations: What Advertisers Need to Know
Google Ads runs multiple auctions for different ad locations. Learn how this impacts Ad Rank, the changes to bidding, and why communication from Google remains unclear.
Google’s RSA Headlines & Sitelinks Update Makes Zero Sense
Google is starting to serve RSA headlines as sitelinks. Here’s what advertisers need to know and why this change makes no sense.

Google Ads Brand Guidelines: Simplifying Advertising and Reducing Fraud
The upcoming changes to brand guidelines will simplify advertising, reduce fraud, and improve account management. See how this may affect you as an advertiser.

The End of Navigation-Less Landing Pages in Google Ads
Google Ads now emphasizes the importance of navigation on landing pages. Learn why this change impacts your campaigns and how to adapt for better performance.

How To Replicate Video Action Campaigns with New Demand Gen Controls
See how Google’s new Demand Gen controls allow you to replicate Video Action Campaigns with channel-specific targeting, making the transition smoother and more effective for advertisers.

How to Succeed with Google PMax Negative Keywords
Google Ads is limiting PMax negative terms to 100 per campaign. Learn more about how to adjust your strategy and make the most of those limited terms.