How To View Geographic & Location Data Directly Within Google AdWords


When it comes to AdWords, all locations are not created equal. It's important to track which locations are converting -- and which aren't. With AdWords, you can increase or decrease bids based on the location you're targeting, and diving into the geographic data can help you better spend your hard earned money.
Of course this data can be found quickly within Google Analytics if you have AdWords auto-tagging enabled and a linked account, but you can also find this information directly within the AdWords interface. Just follow the steps outlined below.
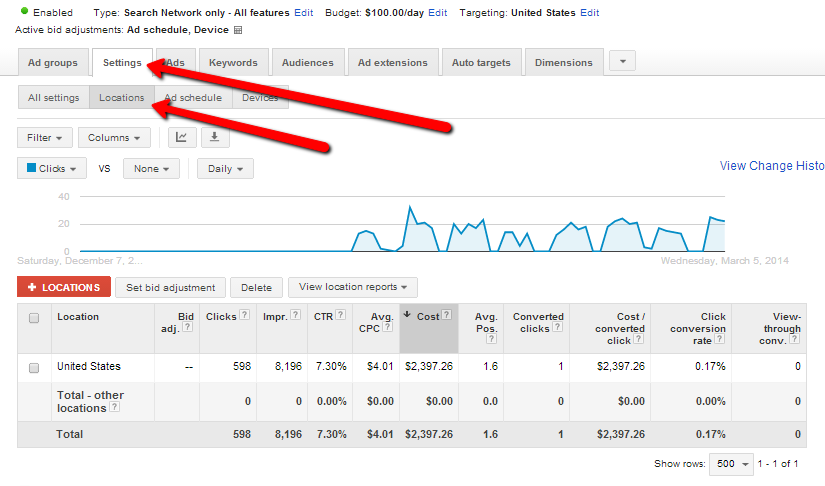
1. View Your Campaign Settings
In the setting tab, you'll see a "locations" button below, click that.
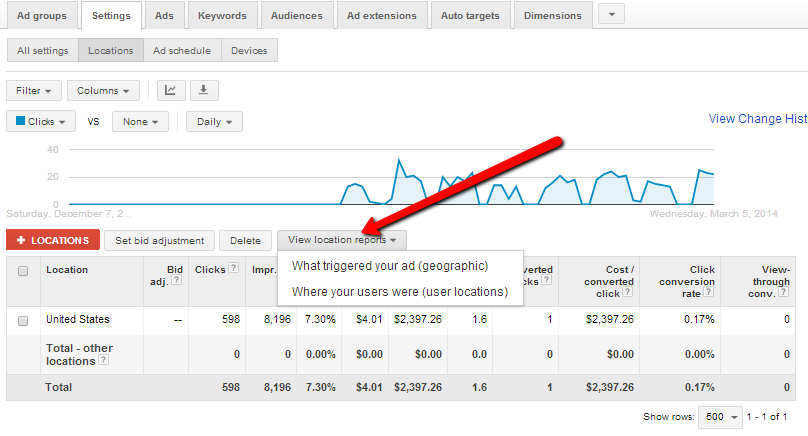
2. View Location Reports
Once inside the location settings, you'll want to see more than just the main targeted location that you chose in AdWords. Click on the "View location reports" and choose whether you want to search by user locations or by geographic terms (this will depend on your overall campaign settings):
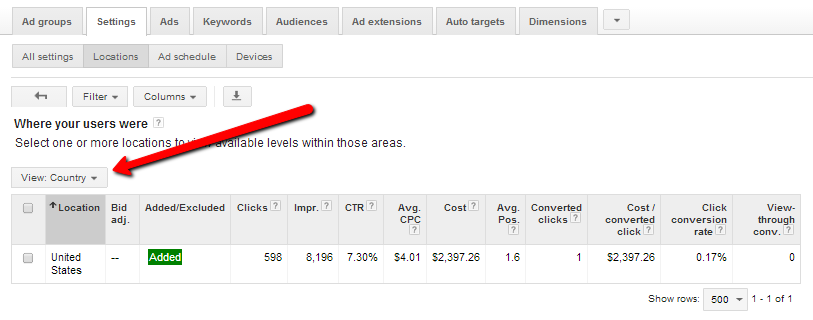
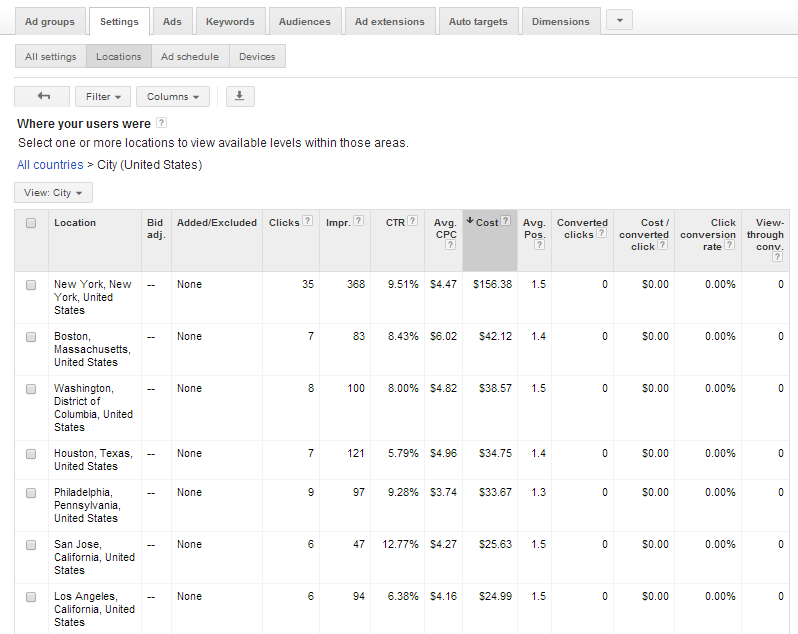
In this case, I wanted to see the overall conversions based on where the users are located, so I chose "Where your users were" report. Furthermore, my goal is to see which cities I am spending the most money on and where I am gathering the most conversions. To see this, click on the "View" button:
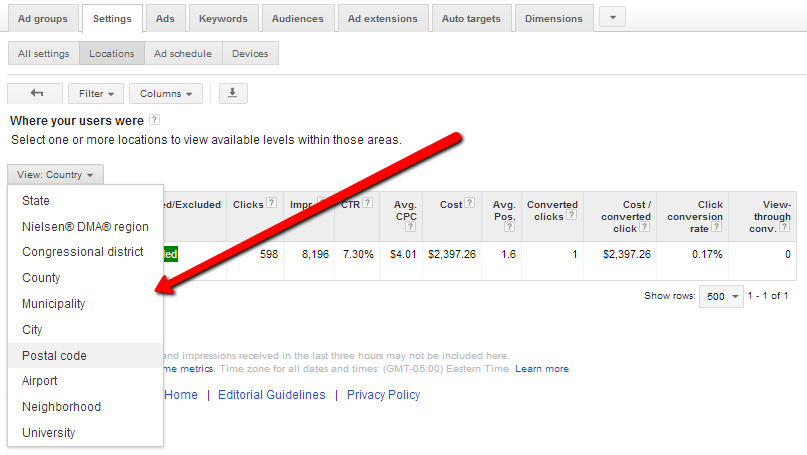
You'll then see the full gamut of targeting options that are available. Again, in this exercise I am looking for city data, so I'll go ahead and choose that selection. The other selections are very handy and can support other marketing initiatives. A few examples where this can by used is when looking at conversion rates for a politician in Congressional districts, or looking at activity by DMA and targeting offline activity based on volume.
3. Gather Your Data
Once you punch in the location view, you'll then obtain all of the data that you are looking for and the number crunching can begin:
Like this? Want more great info? Be sure to follow us on Google+:
Keep up with us on Twitter: Follow @cypressnorth
or of course Instagram and Facebook.
Meet the Author

Greg Finn
Greg is the Head of Performance and Innovation for Cypress North's digital marketing team and one of the founders of our agency. In 2010, he and Matt Mombrea started Cypress North in Buffalo. Greg oversaw the opening of our second office in 2022, located in his hometown of Rochester.
As Head of Performance and Innovation, Greg co-manages our digital marketing department and works closely with our team to ensure all our clients achieve the best possible results. He is always looking for ways to test new digital marketing techniques and technology, and oversees all teaching and training efforts to ensure our agency stays ahead of the curve.
Greg is also a co-host of our weekly Marketing O'Clock podcast, where he and the team provide updates, insights, and hot takes on the latest SEO, PPC, and social media marketing news. In addition to weekly news shows, Greg hosts our Marketing O'Torial digital marketing tutorials and often co-hosts bonus Marketing O'Talk episodes that bring together panels of digital marketing experts.
With nearly two decades of experience, Greg is a known and trusted voice in the digital marketing community. He’s a contributor for Search Engine Land, a member of the Search Marketing Expo (SMX) programming team, and has been a featured speaker at some of the largest search engine conferences, including SMX, eSummit, and Pubcon.
When he’s not working or staying updated on the latest trends, Greg enjoys watching his kids play sports and coaching their soccer team. He’s been named the runner-up “Greg of the Year” on Marketing O’Clock’s annual Clockscars Awards four years in a row. While the coveted award has evaded him for many years, Keanu Reeves has not. Greg once saw him at Gabriel's Gate tavern in Buffalo (and noted he was very tall.)
Related Resources
10 Digital Marketing Hot Takes from SMX Advanced
If you ever need a hot take, put a few hundred digital marketers in one place at the same time. We know there's a lot of advice and opinions out there relating to our industry. So when we were at […]
Google Updates Ad Scheduling Budget Pacing: What it Means for Advertisers
If you use ad scheduling in Google, changes are coming to daily budget pacing. Learn more about the updates and what you can do to prepare.

5 Methods to View a Page as Googlebot
Can search engine crawlers access your content? If you’re not sure, check out these five methods to view your pages as Googlebot and other crawlers.
Google Marketing Live 2025: The Biggest Changes Coming to Google Ads & How They'll Impact You
A lot of news came out of GML 2025, including tons of AI features. Here are the biggest Google Ads announcements and how they could impact you.
AI Max for Google Ads: My Takes as a Digital Marketer
Google Ads just announced its new AI Max feature. Greg Finn breaks down the good vs. the bad and gives his honest opinions on the update.
How to Control Branded Spend in Google Ads
We all know branded spend can sneak up on you. Learn different ways you can control your branded spend in Google Ads.
Google Ads Brand Lists: How to Use Brand Inclusions & Exclusions in Search & PMax
Showing ads for your brand name may be wasting money you could use elsewhere. Learn how to use brand lists, inclusions, and exclusions to control your branded searches.
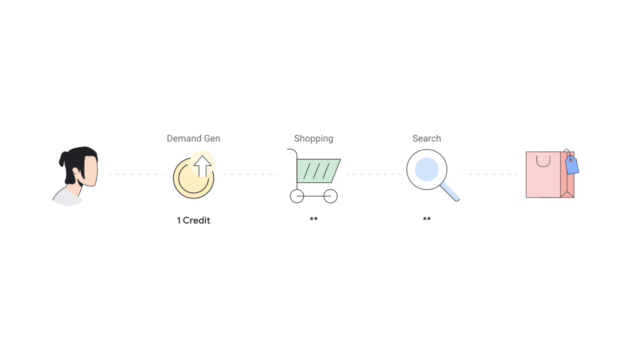
Google Ads Demand Gen Campaigns: From Disappointment to Improvement
Learn how recent updates to Demand Gen in Google Ads can improve visibility and help advertisers make better use of these campaigns.

3 Options for Multilingual Website Translation
Managing multilingual web content is challenging, and there are plenty of options available. Learn more about the solutions and how to find the right one for you.
Are We in a Golden Era of Google Ads?
Is real change coming to Google Ads? Recent changes indicate the team is taking feedback seriously and putting more of a focus on advertisers.
What AI-Driven Search Means for the Future of Publishers
Independent ad-supported publishers face a tough reality with Google’s AI Overviews and zero-click searches. Learn why Google traffic may not be the solution for long-term success.
Why I Changed My Mind About Using PMax
Google is constantly making improvements to Performance Max. Here’s why the former #1 PMax hater changed his mind and now recommends all marketers try this campaign type.
Improve Daily Budget Monitoring in Google Ads with This Simple Script
Managing Google Ads budgets isn’t easy. Here’s a free script you can use to make it less time-consuming and stressful.
Google Launches AI Mode: What it Means for the Future of Search
Google’s new AI Mode marks a major shift in its search strategy. Here’s how we expect it to transform the user experience and future of search.
How Much Are You Really Spending on Your Brand?
Branded spend can sneak up on you when you least expect it. Learn why you should be checking regularly and how to do it effectively.

Multiple Auctions for Different Ad Locations: What Advertisers Need to Know
Google Ads runs multiple auctions for different ad locations. Learn how this impacts Ad Rank, the changes to bidding, and why communication from Google remains unclear.
Google’s RSA Headlines & Sitelinks Update Makes Zero Sense
Google is starting to serve RSA headlines as sitelinks. Here’s what advertisers need to know and why this change makes no sense.
Google Ads Brand Guidelines: Simplifying Advertising and Reducing Fraud
The upcoming changes to brand guidelines will simplify advertising, reduce fraud, and improve account management. See how this may affect you as an advertiser.

The End of Navigation-Less Landing Pages in Google Ads
Google Ads now emphasizes the importance of navigation on landing pages. Learn why this change impacts your campaigns and how to adapt for better performance.

How To Replicate Video Action Campaigns with New Demand Gen Controls
See how Google’s new Demand Gen controls allow you to replicate Video Action Campaigns with channel-specific targeting, making the transition smoother and more effective for advertisers.