Using Python To Combine Datasets For Digital Marketing

Working in digital marketing, there are several reasons why you might want to combine two datasets from two different sources together. It could be combining Google Analytics data from two different accounts or properties, or turning two different reports into one super report - such as combining page data from Screaming Frog with data from Search Console. Whatever your reason may be, you arrived on this page for answers!
In this article, we’ll run through the different ways to combine datasets with Python so you can find the best method for your datasets and goals. We’ll go over:
Fire up a nice new Jupyter Notebook and let’s get started!
Step 1: Set Up
Import pandas
import pandas as pd
Read In Your Datasets
For an introduction on reading in CSV and XLSX files, take a look at Python & Google Analytics: Prepare Data For Analysis.
gsc1 = pd.read_csv("GSC 1.csv")
gsc2 = pd.read_csv("GSC 2.csv")
The process is similar for other file types like JSON or HTML - if you need to read in one of these or from a database, a quick Google search should return the answers you need.
Step 2: Choose Your Method
Concatenation
Concatenation is used to essentially add one dataset on to another. The datasets must have the same column or row names so you can add one to the other and create one big dataset.
In the example below, I have query data from two different Google Search Console accounts (actual queries hidden for privacy!). Both websites/accounts are under the same parent brand and my goal is to create one master report of their search query data.
After importing pandas and reading in my CSV files, I take a look at the head of each dataset to make sure everything pulled in okay and my columns are indeed identical between both datasets:
I also want to take a look at the info on each of these DataFrames so I can compare it to my concatenated DataFrame to make sure it all adds up.
1,000 entries on each - noted! I should then expect 2,000 on my concatenated DataFrame.
Now it’s time to concatenate. This is done with one simple line where you are passing your DataFrames into the concat function as a list.
As expected, there are 2,000 rows, and my same 5 columns remain.
As you can see, the data is concatenated on the row by default. If the dataset you’re using requires you to concatenate on the column instead of the row, specify the axis=1:
pd.concat([df1, df2], axis=1)
I’m also going to set this DataFrame to a new name so I can call it later on.
From here, you’ll need to do some work to clean up the data to handle any missing values and duplicate queries.
Merging
Merging should be used when you want to combine datasets that contain different dimensions. It requires at least one common column to merge the reports on.
Unlike the concatenation example, I may want to create a really powerful report that combines page data from Google Analytics and Screaming Frog. Each of these reports will contain different columns but will have the page URLs in common.
I’ll start by reading in my CSV files and viewing the heads:
A couple things to note here:
- The URLs are hidden for privacy, but you can see with this little glimpse that Google Analytics uses only the page path, while Screaming Frog uses the full address including the domain. For the merge to work properly, I’ll need to change the URL structure on one of the datasets to make them match.
- I plan on merging my DataFrames on the “Page” column but as you can see, Google Analytics calls it “Page” and Screaming Frog calls it “Address”. There are two different ways to handle this, I’ll go over both to show how the output differs:
Before we run through how each of these work, let’s take a look at the info on each DataFrame so we can compare it with our merged DataFrame.
Merge DataFrames On a Shared Column Name (on parameter):
I’ll start by changing the “Address” column on my Screaming Frog data to match Google Analytics’ “Page” column, and adding the domain onto my Google Analytics page paths so both DataFrames use the full URL.
Now, I can merge on the common Page column:
Since I’m using an inner join, rows only remain if they had a common URL between both datasets. The inner join is the default used by pandas and is the one you’ll probably want to use in most cases. But, be aware that pandas also supports left, right and outer joins if you need them.
Merge DataFrames Using Different Column Names (left_on and right_on parameters):
With this method, I’m specifying the different column names to merge on.
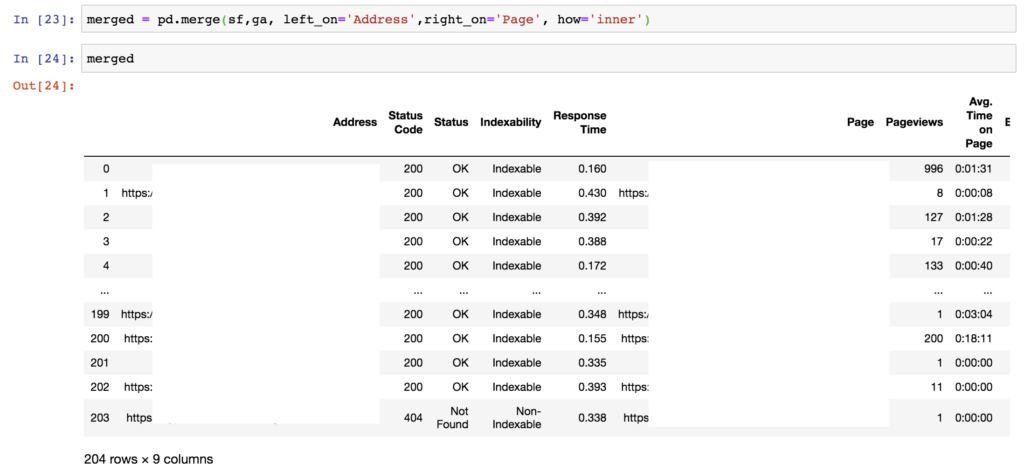
As you can see, my merged DataFrame contains the same amount as rows as using the on parameter, but I have an extra column. With this method, both columns that were merged on appear in the DataFrame. Personally, I prefer using the on parameter to keep the DataFrame cleaner.
Joining
Joining is essentially the same idea as merging, except it’s used when you want to join on an index instead of a column.
This is done by adding the join function to one of the DataFrames and passing in the other DataFrame. Using my DataFrames, it would look like:
ga.join(sf)
This will default to an inner join, but you can also specify a different type of join:
ga.join(sf, how='left')
Step 3: (optional): Export Your Data
At this point, you might have more work to do in your Jupyter Notebook or elsewhere, but if and when you’re ready, you can export your new dataset into a CSV or excel file.
gsc_all.to_csv('all_gsc.csv')
gsc_all.to_excel('all_gsc.xlsx')
Your file will save to the same place that the Jupyter Notebook you’re working in is located.
I hope this article helped you find the best way to combine your datasets. Now you can join me on the road to better reporting! Don’t forget to merge in carefully! If you can think of a pun for concatenation or would like to share how you’re actually using these methods to make meaningful datasets and reports, please share in the comments below!
While you’re here, check out all of the ways Cypress North can use data & analytics to help your business.




![Data - Blog - Google Collab [Background]](https://cypressnorth.com/wp-content/uploads/2024/03/Data-Blog-Google-Collab-Background-640x360.jpg)


