Exploring a New Dataset With Python: Part I
We’re taking it back to the basics in this article.
Why?
The day of a Digital Marketer is busy. We’re pulled in all sorts of different directions and are responsible for a lot of different things. In my personal experience, it’s easy to get caught up in non-stop execution and forget that taking the time to sit with, think about, and explore a topic is also a necessary part of many things we do.
In this case, we’re talking about new datasets. As Digital Marketers, we’re often given datasets that another team and/or company has been collecting, sometimes for years, that is brand new to us. Usually they’re turning to us for a better way to manage the data or to transform it into something more user-friendly, like an interactive dashboard.
When you first open up the spreadsheet and see all of the foreign columns and rows and acronyms that you didn’t create, the feelings of jumping in and getting started might start to build. There’s a lot of charts to be made and they won’t make themselves!
BUT, this is when it’s time to remember everything you’ve learned from your meditation app - take a breath and remember that this whole process will be easier if you set aside time to explore the dataset, familiarize yourself with it, understand what is being tracked and what will be important for your audience to learn from it.
There’s a lot to unpack in a new dataset, so I’m splitting the exploration process into two parts:
- The Basics
- Visualizations
This article will go in-depth on Part I: The Basics. Part II: Visualizations will be covered in a future article.
We’ll be using Python to complete both parts. It’s a great tool to go through the data exploration process with - you’ll get quick stats and breakdowns on the data, and can easily put visualizations together to identify trends and outliers all in one notebook.
The steps in this article will help you understand:
- What information is being collected
- How the dataset is set up
- How much information is in the dataset
- If there are any null values
- Basic statistics on each column
- How to prompt additional questions about the dataset that you can answer for further understanding
I’ll be taking notes along the way with my findings for each section related to the dataset I’m analyzing. I’ll be using a fake dataset that I whipped up on product sales for an animal mug company that I also made up. I’ve been drinking a lot of coffee, alright?

Let’s dive in!
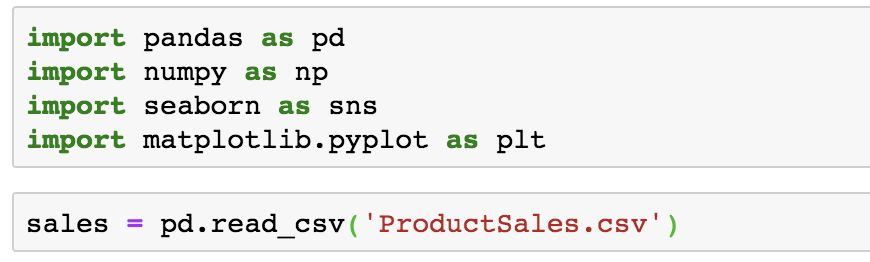
Import libraries and your data file
All of the Python libraries shown here aren’t necessary to cover The Basics, but it will set you up to complete the visualizations later on as well. If you only want to import what’s necessary for this part, you only need pandas and numpy.
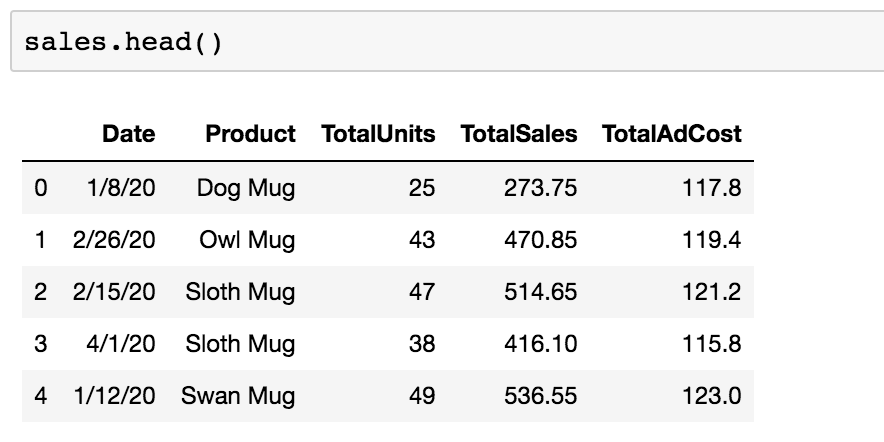
DataFrame.head()
Once my data is imported into a Jupyter Notebook, the first thing I always like to do is to look at the head() to see what columns the dataset contains.
This helps me get familiar with what the dataset is about and what is being tracked. If I were seeing this dataset for the first time, I could see that it’s sales data by day for different mug products as well as the amount spent on advertising for that day.
Notes:
Looking at this, I already have a few questions.
- What dates does the data begin and end on?
- Are there multiple rows for each date, i.e. a row for each product per day? The dates are out of order here so it’s hard to tell.
- How many unique products are there?
These questions will drive some additional exploration to familiarize ourselves with the data.
Before we get to that, I’m going to keep running through the initial exploration steps and keep track of any other questions or thoughts I come up with.
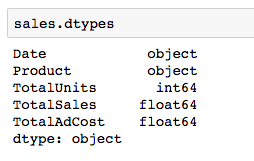
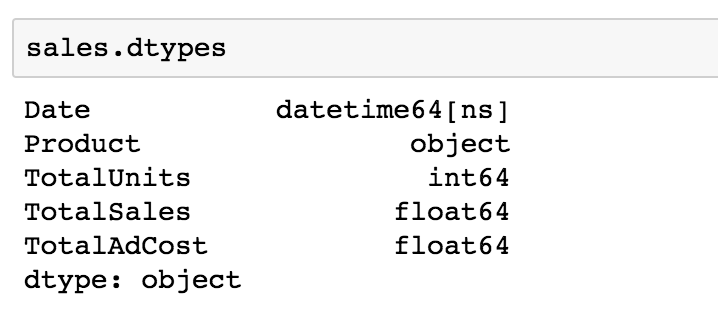
DataFrame.dtypes
This will tell you the datatype of each column. These are important to be aware of, especially if you’re going to be performing aggregations, creating visualizations, or really doing any other manipulation to the dataset.
Many of these things won’t work properly if the data is not coming in as the proper type (a number coming in as an object, for example). Take note of anything that doesn’t look right so you can convert it to the proper data type.
Notes:
- Columns that contain numbers are coming in as numerical data types - all good there.
- My product column that contains text values is coming in as an object. Depending on what type of work I plan on doing with this dataset, I may want to change it to a string.
- There is no dedicated date type for dates, so object is fine. There is a datetime module that can be imported to work with dates (and times) - we’ll make this conversion later in the article.
DataFrame.shape
Short and sweet, this returns the number of rows and columns in the dataset to give you an idea of how large it is.
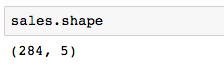
Notes:
- My dataset has 284 rows and 5 columns
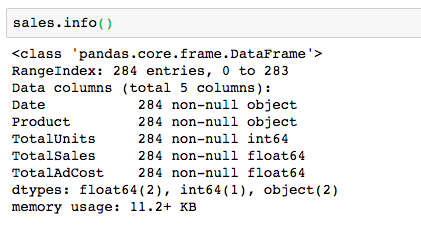
DataFrame.info()
This can be used as an alternative to df.dtypes and df.shape. It will give you that information plus the memory usage of the DataFrame and how many non-null values exist in each column, which can be useful.
If my TotalUnits column reported 280 non-null values, I would know that there are 4 null values in that column that I’d need to handle.
DataFrame.describe()
I saved the best for last in our data exploration basics. Here we’ll get some summary statistics on our numerical columns. I’m adding round(2) to round the values to the nearest hundredth, but it’s not necessary to include, or you can change the decimal place it rounds to to your liking.
This gives a nice overview of the data in these columns: how many values there are (count), smallest (min) and largest (max) values, quartiles (25%, 50%, 75%), mean, and standard deviation.
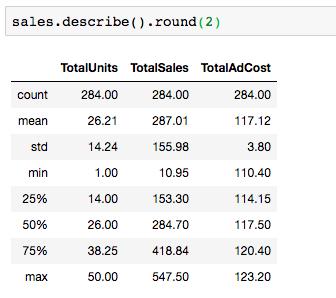
If you have columns with object data types, you can still use df.describe(), you’ll just need to separate them out from the numerical columns - DataFrames with mixed data types will default to only returning the numerical summary.
Bonus Round! Q&A
Our initial exploratory steps are complete to get a lay of the new dataset land. Now, I’m going to go back and answer the lingering questions I came up with along the way.
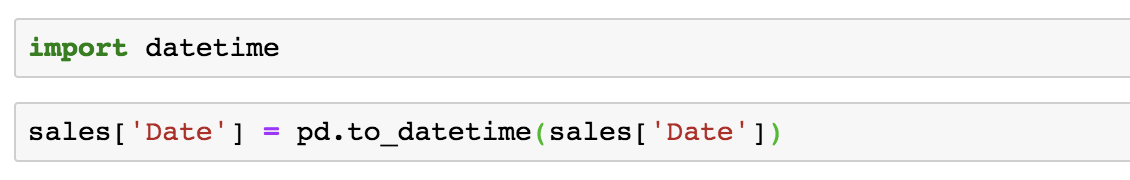
What dates does the data begin and end on?
Here is where the datetime module will come in handy. I’m going to import that first and it will make some new, helpful options available to answer questions like these.
Then, I’m going to convert the Date column into a datetime data type.
If I check the dtypes again, you can see that my Date column is now converted:
I’ll now be able to check the start and end dates on the dataset. I can see that it starts on January 1, 2020 and ends on April 6, 200

Are there multiple rows for each date, i.e. a row for each product per day?
My main issue here is that the dates aren’t ordered. There is more than one way to get the answer to this, but all I’m going to do is order the dates to see what the first few rows look like.
To sort by the date column, you’ll need to use the datetime module to convert your Dates to a datetime datatype. So if you skipped the last question, go back and see how it’s done!
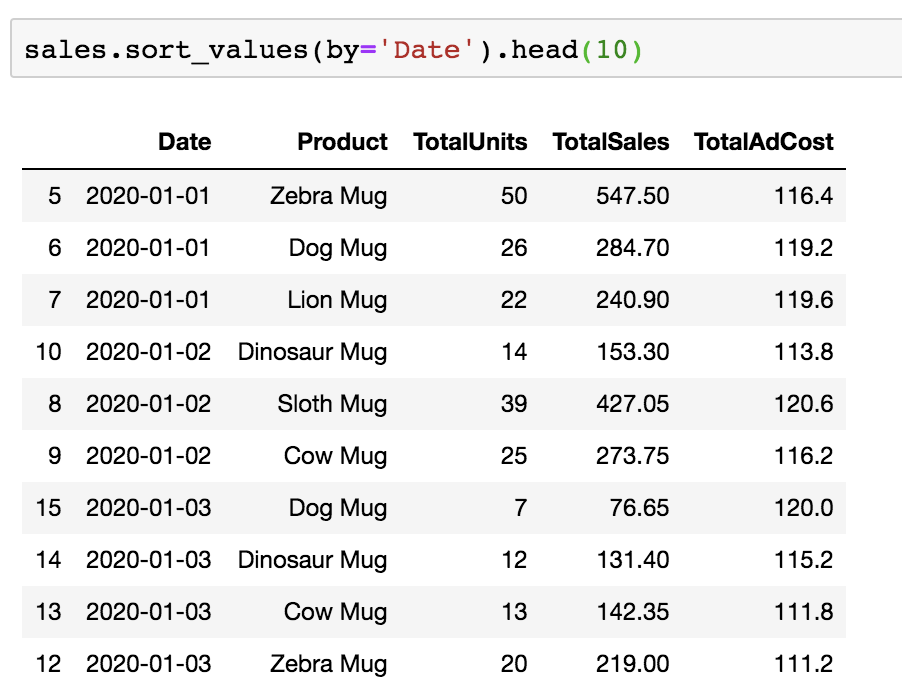
Looking at the first 10 rows, it does indeed appear that there is a row for each product’s sales and advertising cost per date.
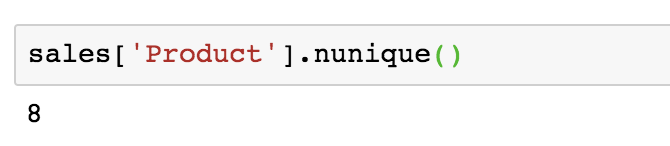
How many unique products are there?
All I have to do for this one is use nunique() to get the number of unique values in my products column. I can see that the dataset is reporting on 8 different products.
Continue on to Part II
We’ve completed The Basics and we’ve already learned a lot about our new dataset! Check out Part II where we continue the data exploration process with Python to create some visualizations and understand more about our data.
Related Resources

Is Your Digital Marketing Strategy Putting You at Risk? Understanding CCPA’s New Legal Precedent
Capital One’s privacy lawsuit highlights growing risks for marketers relying on standard tracking technologies. Here's what you need to know.

Using BigQuery to Overcome GA4 Data Retention Limits
Keep your GA4 data forever with BigQuery. Learn how to set up BigQuery to start storing raw GA4 data before it's gone for good.

Why US Businesses Need to Prioritize Data Privacy Now
The U.S. doesn't have a comprehensive national data privacy policy in place, but that doesn't mean businesses aren't being impacted. Learn more about the state-level policies reshaping digital marketing strategy and compliance.
![Data - Blog - Google Collab [Background]](https://cypressnorth.com/wp-content/uploads/2024/03/Data-Blog-Google-Collab-Background-640x360.jpg)
How to Get Started Using Python for Data Analysis in Google Colaboratory
Learn how to use the free Google Colab tool and perform data analysis with Python programming language in this tutorial for digital marketers and data analysts.

How to Save Universal Analytics Data
All historical data from Google’s Universal Analytics will be deleted on July 1, 2024. Learn more about what your options are for backing it up before it’s gone for good.

Is Google Analytics 4 a Tactical Move Away From Free Analytics?
There’s something fishy going on with the way that Google is handling GA4. To me, it’s playing out as a backdoor cash grab, hidden under a thin veil of a free and easy migration from UA.

Data Lakes & Data Warehouses: What Are They? (& Why Your Company Probably Needs Both)
Data lakes and data warehouses have gained increased interest from organizations in recent years for their ability to support a single source of truth for data-driven decision-making across various departments. Understanding the strengths and applications of each is important not […]

How to Get Started with GA4: A Step-by-Step Guide
Need help setting up GA4 for your company or client’s website? Look no further! This post provides a step-by-step process for creating GA4 properties and best practices to make sure necessary events are tracked and the data flowing into GA4 are accurate.

How To Change Your Google Analytics Attribution Model in GA4
One of the biggest changes to Google Analytics has arrived in 2022 - the ability to change your Google Analytics attribution models. This is a first for Google Analytics as this attribution model change will not just apply to a […]
Why You Should Set Up Google Analytics 4 Today
Let's face it. GA4 isn't GR8. Google Analytics 4 is a work in progress to put it kindly. However, in these final weeks of 2021 you have an opportunity to get GA4 installed and tuned up, giving your future self […]

What to Include in a PPC Dashboard
Learn What Metrics to Include in PPC Reports. Then, Download Our Free Data Studio Dashboard Template! Let’s be real, pay per click advertising is all about data. What campaigns are bringing in the most revenue? What landing pages are converting […]

6 Google Ads Custom Columns to Help Uncover More Data
You may already know you can create custom columns in the Google Ads online interface. But, if you're anything like me, you may not always think about how you can leverage custom columns to surface essential Google Ads performance metrics, […]

How To See Audience Performace Across Campaigns With Google Ads Reports
Google Ads makes it really easy to see performance at the campaign or ad group level, but analyzing audience performance across multiple Google Ads campaigns is easier said than done. You're left wondering.... What's working well? What's not? Combining like-minded […]

Install Google Analytics on Web Stories With the Official WordPress Plugin
You read that right - the moment we've all been waiting for is here! Google’s Web Stories plugin is out of beta and now offers the ability to install Google Analytics on Web Stories directly in the plugin. If you […]
Cross-Domain Tracking With Google Tag Manager: A Simple Guide
Cross-domain tracking can make your life a lot simpler if you find yourself having to analyze Google Analytics data from two different sites. It allows you to capture the full user journey from the moment they land on one domain […]

Why Don't Multi-Channel Funnel Reports Match Up With Other Reports in Google Analytics?
Why don't numbers from the multi-channel funnel reports match up with numbers for the same metrics in other Google Analytics reports? The discrepancy is largely due to differences in what Google considers direct traffic. Read our guide to gain a full understanding of attribution differences in Google Analytics reporting.

Exploring a New Dataset With Python Part II: Using Seaborn To Visualize Data
Welcome to Part II of Exploring a new dataset with Python! If you missed Part I: The Basics, you can check it out here. In this article, we’ll be returning to our animal mug company’s dataset to continue our exploratory […]

Strip Query Strings From URL Data: Python For Digital Marketing
If you’ve ever spent any time in a Google Analytics account, you’re all too familiar with the fact that the data isn’t always pretty. One exceptionally common scenario that us marketers run into all the time is page data being […]
Pandas Groupby Function: Python for Digital Marketing
If you’ve been following along with our Python for Digital Marketing posts, you’ve imported data from Google Analytics into a Jupyter Notebook and may have even combined it with another dataset. If you’ve never been here in your entire life […]

Using Python To Combine Datasets For Digital Marketing
Working in digital marketing, there are several reasons why you might want to combine two datasets from two different sources together. It could be combining Google Analytics data from two different accounts or properties, or turning two different reports into […]