Strip Query Strings From URL Data: Python For Digital Marketing

If you’ve ever spent any time in a Google Analytics account, you’re all too familiar with the fact that the data isn’t always pretty. One exceptionally common scenario that us marketers run into all the time is page data being split up due to query parameters in the URL. It’s not uncommon for a landing page from an ad campaign, for example, to take up hundreds of rows in an analytics report. Each click generates a unique combination of parameter values including click ID, device, placement, or any other parameters you may be tracking. Google Analytics sees each of these as a unique URL that goes into its own row, making it difficult for marketers to see true totals or averages for the page.
While these parameters are usually put in place for a reason and are extremely valuable for campaign tracking, I always recommend setting up a separate view in every Google Analytics account that filters out the parameters so you can flip back and forth depending on what you need. But, this doesn't always happen and there are plenty of times when you’re stuck cleaning up the messy data for one reason or another.
In this article, I’m going to show you how you use Python's pandas library to:
- Strip the query string off of each URL
- Aggregate the data for each URL
- Create a nice clean CSV file that has the aggregate value for each URL
We’ll use techniques from our past blogs, including exporting data from Google Analytics and reading it into a Jupyter Notebook, and grouping data using the groupby() function. So if you’re new to any of these steps, check those out first for full explainers.
To start, you should have the page data you need exported from Google Analytics along with all of the columns that you’re interested in.
Go ahead and import the pandas library and your Google Analytics file, and take a look at the info() and the head().
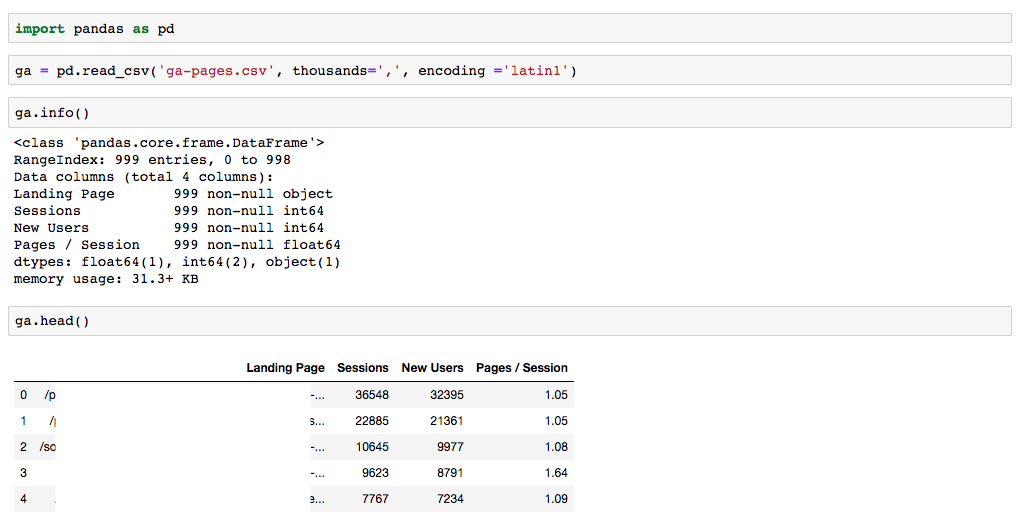
In the info() output, take note of the data types for each metric. If your numbers contain commas, they’ll come in as objects instead of a numeric data type and you’re going to have problems later on when it’s time to aggregate the data. Use your favorite method to make sure your numbers are actually coming in as numbers - for mine, I simply used the thousands separator when reading in my CSV.
Next up, we’re going to split the URL where the query string starts, on the question mark. The first part will be the page path (the part we want), and the second part will be the query string. I’m going to add str[0] so it only displays the first part.
This will replace the values in the Landing Page column.
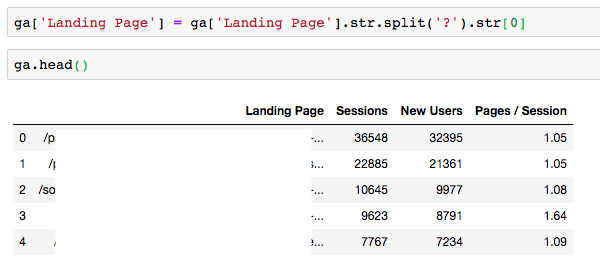
Okay - our dataframe is cleaned up and we’re only looking at URL paths that have the query strings removed.
Now, we can group by each URL. This means that data will be aggregated for all duplicate URLs. In this next step, I’m defining which type of aggregation I want for each metric - I want the sum for Sessions and New Users, and the average for Pages/Session. I’m adding round(2) to keep my Pages/Session values to the nearest hundredth.
newga = ga.groupby('Landing Page').agg({'Sessions':'sum', 'New Users': 'sum', 'Pages / Session': 'mean'}).round(2).reset_index()
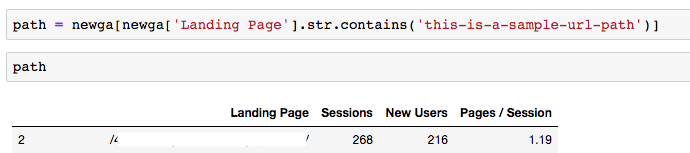
You can either take a look at your data here in the Jupyter Notebook, filtering by a certain URL path for example:
Or, you can export all of your data to a new CSV file to explore.
newga.to_csv('pages-noparams.csv')
This will give you the full list of your pages and their aggregate values. Now look at your clock and see how much time you saved! If crunching the numbers is still taking up a bit too much of your time, see how we can work together on your next data & analytics project. Happy reporting.
Related Resources

Is Your Digital Marketing Strategy Putting You at Risk? Understanding CCPA’s New Legal Precedent
Capital One’s privacy lawsuit highlights growing risks for marketers relying on standard tracking technologies. Here's what you need to know.

Using BigQuery to Overcome GA4 Data Retention Limits
Keep your GA4 data forever with BigQuery. Learn how to set up BigQuery to start storing raw GA4 data before it's gone for good.

Why US Businesses Need to Prioritize Data Privacy Now
The U.S. doesn't have a comprehensive national data privacy policy in place, but that doesn't mean businesses aren't being impacted. Learn more about the state-level policies reshaping digital marketing strategy and compliance.
![Data - Blog - Google Collab [Background]](https://cypressnorth.com/wp-content/uploads/2024/03/Data-Blog-Google-Collab-Background-640x360.jpg)
How to Get Started Using Python for Data Analysis in Google Colaboratory
Learn how to use the free Google Colab tool and perform data analysis with Python programming language in this tutorial for digital marketers and data analysts.

How to Save Universal Analytics Data
All historical data from Google’s Universal Analytics will be deleted on July 1, 2024. Learn more about what your options are for backing it up before it’s gone for good.

Is Google Analytics 4 a Tactical Move Away From Free Analytics?
There’s something fishy going on with the way that Google is handling GA4. To me, it’s playing out as a backdoor cash grab, hidden under a thin veil of a free and easy migration from UA.

Data Lakes & Data Warehouses: What Are They? (& Why Your Company Probably Needs Both)
Data lakes and data warehouses have gained increased interest from organizations in recent years for their ability to support a single source of truth for data-driven decision-making across various departments. Understanding the strengths and applications of each is important not […]

How to Get Started with GA4: A Step-by-Step Guide
Need help setting up GA4 for your company or client’s website? Look no further! This post provides a step-by-step process for creating GA4 properties and best practices to make sure necessary events are tracked and the data flowing into GA4 are accurate.

How To Change Your Google Analytics Attribution Model in GA4
One of the biggest changes to Google Analytics has arrived in 2022 - the ability to change your Google Analytics attribution models. This is a first for Google Analytics as this attribution model change will not just apply to a […]
Why You Should Set Up Google Analytics 4 Today
Let's face it. GA4 isn't GR8. Google Analytics 4 is a work in progress to put it kindly. However, in these final weeks of 2021 you have an opportunity to get GA4 installed and tuned up, giving your future self […]

What to Include in a PPC Dashboard
Learn What Metrics to Include in PPC Reports. Then, Download Our Free Data Studio Dashboard Template! Let’s be real, pay per click advertising is all about data. What campaigns are bringing in the most revenue? What landing pages are converting […]

6 Google Ads Custom Columns to Help Uncover More Data
You may already know you can create custom columns in the Google Ads online interface. But, if you're anything like me, you may not always think about how you can leverage custom columns to surface essential Google Ads performance metrics, […]

How To See Audience Performace Across Campaigns With Google Ads Reports
Google Ads makes it really easy to see performance at the campaign or ad group level, but analyzing audience performance across multiple Google Ads campaigns is easier said than done. You're left wondering.... What's working well? What's not? Combining like-minded […]

Install Google Analytics on Web Stories With the Official WordPress Plugin
You read that right - the moment we've all been waiting for is here! Google’s Web Stories plugin is out of beta and now offers the ability to install Google Analytics on Web Stories directly in the plugin. If you […]
Cross-Domain Tracking With Google Tag Manager: A Simple Guide
Cross-domain tracking can make your life a lot simpler if you find yourself having to analyze Google Analytics data from two different sites. It allows you to capture the full user journey from the moment they land on one domain […]

Why Don't Multi-Channel Funnel Reports Match Up With Other Reports in Google Analytics?
Why don't numbers from the multi-channel funnel reports match up with numbers for the same metrics in other Google Analytics reports? The discrepancy is largely due to differences in what Google considers direct traffic. Read our guide to gain a full understanding of attribution differences in Google Analytics reporting.

Exploring a New Dataset With Python Part II: Using Seaborn To Visualize Data
Welcome to Part II of Exploring a new dataset with Python! If you missed Part I: The Basics, you can check it out here. In this article, we’ll be returning to our animal mug company’s dataset to continue our exploratory […]

Exploring a New Dataset With Python: Part I
We’re taking it back to the basics in this article. Why? The day of a Digital Marketer is busy. We’re pulled in all sorts of different directions and are responsible for a lot of different things. In my personal experience, […]

Pandas Groupby Function: Python for Digital Marketing
If you’ve been following along with our Python for Digital Marketing posts, you’ve imported data from Google Analytics into a Jupyter Notebook and may have even combined it with another dataset. If you’ve never been here in your entire life […]

Using Python To Combine Datasets For Digital Marketing
Working in digital marketing, there are several reasons why you might want to combine two datasets from two different sources together. It could be combining Google Analytics data from two different accounts or properties, or turning two different reports into […]