Precisely Target Your Ideal B2B LinkedIn Audience With One Powerful Tool
LinkedIn is an incredible tool for B2B marketers due to its unique targeting; namely professional information like job titles and company industries.
I’m sure you’ve spent precious time crafting your audiences, but targeting is just the beginning. Arguably, audience exclusions play an even more important role than targeting.
Having the right exclusions can make or break your campaign’s success and curtail erroneous spend on unwanted segments.
But how do you know which audiences to exclude?
By auditing your audience performance through LinkedIn Ads’ handy Demographic Report!
In this post, we’ll show you where to find the demographic report, how to use it and why it matters.
LinkedIn Demographics Reporting
Yeah, yeah - I know what you might be thinking; every platform provides demographic data, so what?
Two words: job & company.
Linkedin’s demographic report is much more robust than other ad platforms, allowing you to segment by:
- job function
- job title
- job seniority
- company
- company industry
- company size
- location
- country
This demographic data isn’t just nice to look at, it can be an extremely powerful tool and help you define a precise audience to see your ads. From the demographics tab, anything that is less than ideal can be excluded from your campaigns.
Removing unwanted job titles, functions, or companies from your campaign’s targeting will instantly improve your precision in building niche B2B audiences and save budget.
It is important to note that you can only see impressions, clicks, and average CTR when segmenting by demographics. Despite a lack of conversion data, seeing where clicks are coming from is still important to review, especially considering the average minimum CPC is $4/click across many Linkedin audiences.
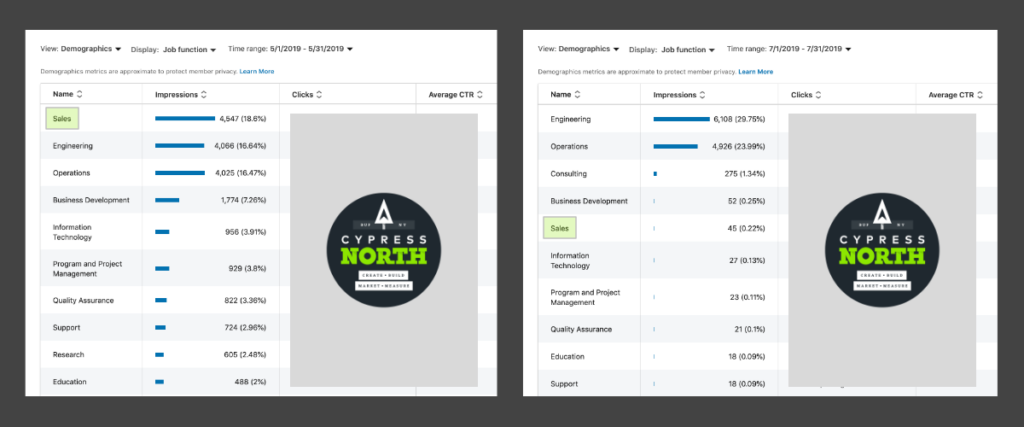
Don’t just take my word for it, here’s a real-life example from one of our clients...
In two months time, I was able to decrease impressions on an unwanted job function by 99% after excluding that unwanted job function from my campaign’s audience.
How to Use the Demographics Report
The following steps will drop you right off at the report and send you into straight into an exclusion list frenzy.
- Step 1: Log in to Campaign Manager and select your account.
- Step 2: Select either a campaign group, campaign(s), or ad(s) by checking the box(es) next to the title. Once you check a box(es), you should see the button for demographics become clickable with a dark blue shade. The screenshot below is from the campaign groups tab.
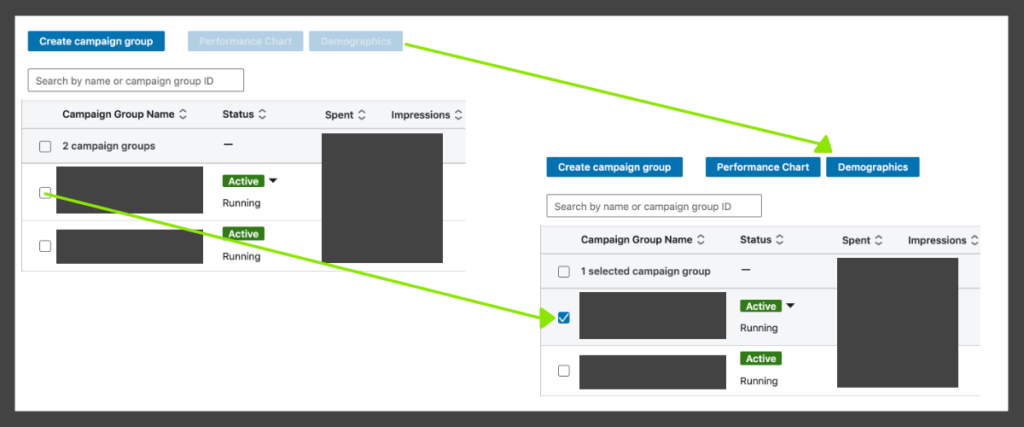
- Step 3: Once you’ve selected your desired number of items with the checkboxes, click:

- Step 4: Select the demographic segments from this drop-down menu:

- Step 5: Have at it! You’ll see a detailed and specific demographic breakdown.
Warning: you might not like what you see, but luckily, it's an easy fix that you can implement immediately.
- Step 6: If you find any unwanted targeting, simply head over to your campaigns tab, add the unwanted items to your exclusion lists, and update your audiences.

PRO TIP: LinkedIn limits how many exclusion selections you make, so marketers need to be strategic about which audiences they exclude. We haven’t found the magic number of exclusions you can set before you get cut off, but have added as many as 175 before receiving an error.
To combat this, it’s best to exclude from broader categories whenever possible.
For example, if you want to exclude everyone who works in sales, you could do so by job title. However, there are 9 different sales job titles nestled within the sales job function. So, if you exclude the sales job function rather than each sales job title, you'll be able to add 8 additional exclusions. If it makes sense for your campaign, excluding broader audiences is much more efficient and eases the pressure of exclusion limits!
Pro Tip: A performance report that shows conversions is also available on the platform, but it does not plot conversions against any demographic segments. It’s simply a plotline of conversions on a timeline.
You can access it with this drop-down menu positioned next to the demographic segment drop-down.

There you have it! That’s how to use the LinkedIn Ads Demographic Report to improve your targeting. Now that you understand where to find it and how to use it to improve campaign performance, let us know what audience insights you uncovered in the comments below. Be sure to sign up for our newsletter so you won’t miss our future posts in our B2B series.
Related Resources

13 Digital Marketing Predictions for 2025
Top Industry Voices Share Their 2025 Digital Marketing Trend Predictions As digital marketers, we know a new year brings new goals, new opportunities for growth, and new challenges. But a new year also brings plenty of change. Whether it’s advancements […]

B2B Marketing With the Rise of Gen Z: Navigating the Digital Native Workforce
Explore the unique challenges & opportunities of marketing to Gen Z in the B2B space. Discover how these digital natives are reshaping the professional world & what it means for marketing strategies. Stay ahead in the era of Gen Z with expert insights.
5 Steps to Conduct a Successful Social Media Audit
Are your social media platforms in need of a refresh? Follow these 5 steps to audit and optimize your platforms for success.

5 Tips for Getting the Most Out of the LinkedIn Ads Campaign Manager
Read these 5 ways you can leverage the insights in the LinkedIn Ads Campaign Manager to manage and optimize your LinkedIn ads.
23 Of The Best Resources For Starting A Digital Marketing Career
The best social media communities, podcasts, newsletters, and certifications for new digital marketers I didn’t know anything about digital marketing when I started as an intern at Cypress North earlier this year. Acronyms like SEO, CPA, and ROAS meant nothing […]
Pinterest as a Search Engine: An Advertisers’ Guide to Keyword Targeting in Pinterest Ads
Pinterest – the land of dream wedding dresses, instant pot recipes, room inspo, and… SERPs? Pinterest is so much more than a social media platform. Yes, the platform allows users to like, share, and discover new content based on their […]

Why You Shouldn’t Overlook LinkedIn Video Ads For Your B2B Marketing Strategy
LinkedIn Ads is certainly not the first place B2B marketers think to spend their video budget, but it should be! Yes, I know. LinkedIn at face value is a pricey platform in general. However, I’ve found LinkedIn Video Ads are […]
How to Use Adobe Acrobat Pro DC to Make Interactive PDFs For Inbound Marketing
Creating unique downloads for your content marketing campaign can be a struggle. With millions of resources available online, how can you distinguish your downloads from the assets your competitors are providing? By making them interactive of course! You can unlock […]
How to Use Your CRM for More Effective Advertising and Digital Marketing
Think a digital marketer’s job is done after the conversion? Think again. Performance-based advertising and digital marketing aren’t just about generating traffic and conversions. It’s also about driving quality. It’s about producing a return. It’s about being able to directly […]
5 Simple Tips For Lowering Costs in Linkedin Ad Campaigns
These seemingly small, easy to overlook best practices will lower your ad spend and CPA. As many seasoned B2B advertisers know, LinkedIn’s powerful professional targeting and niche audience segmentation is hard to beat for business advertising. But if you’re a […]

What Is CRM Retargeting and Why Is It a Necessity for B2B Digital Marketing?
Most marketers and internet users alike are familiar with the concept of web retargeting: the practice of serving ads to internet users based on how they’re interacted with your company’s website. However, far too many people are unfamiliar with CRM […]
How to Transform Your Static Images into Animated Video Ads With Facebook’s Video Creation Kit
As the digital space continues to evolve, video has become more dominant than ever before. Attention spans are shorter, people expect to be entertained, and messaging must be communicated in a fascinating way. For businesses with limited time and budget, […]
Best Digital Marketing Podcasts
Whether you're focused on SEO, PPC, social media, content, or affiliate marketing, podcasts are a great way to stay competitive in the dynamic digital marketing landscape. Finding a reliable program to consume from your car, desk, or treadmill allows you […]
Facebook Ads Budget Optimization: Everything You Need To Know
Facebook has major news for advertisers. Come September 2019, account managers will no longer be able to set budgets at the Ad Set level in Facebook Ads. Instead, Facebook's Campaign Budget Optimization will become the default setting for all campaigns, […]
Deep Dive: Reddit Ads Update
With this Reddit Ads update, Reddit expressed interest in offering more options for marketers but did this update miss the mark? We're diving deep into what the update includes, how to navigate it, and how you should adjust your Reddit […]
Digital Marketing in 2019: What to Watch For
The Pros Rampant Responsive One of the biggest boons for advertisers in 2018 was the ability to optimize campaigns by moving away from standard banner sizes and utilizing responsive display ad formats. The proliferation of flexible ads such as Facebook […]
How To (Properly) Share Access to Pages & Ad Accounts in Facebook Business Manager
Facebook's Business Manager has been a boon for advertisers and agencies across the world. With simple sharing, no transferring of ownership, easy transition from client to client and easy employee access, there's not a lot to complain about. The only […]
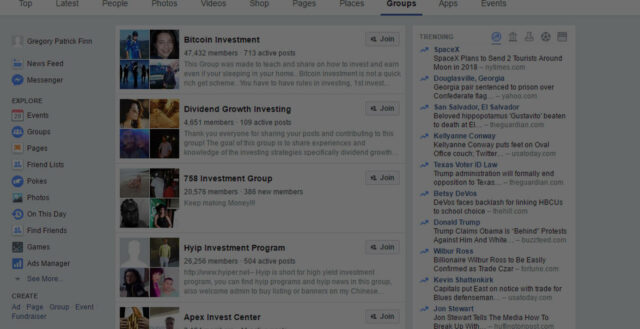
Why You Shouldn’t Use Facebook Groups To Build a Community
Never have Facebook Groups been more prevalent than they are today. It seems like every podcast you listen to and site you visit is pushing fans, listeners, and visitors to follow along in a Facebook Group. It’s true, Facebook Groups […]

Instagram for Business: Pros and Cons of Instagram's Changing Platform
The Marriage of Facebook and Instagram Instagram has had quite the last 4 years. When Facebook originally acquired Instagram for $1 billion in 2012, not much initially changed for the platform. Nonetheless, it was clear that with Facebook's back-to-back purchase of […]

What to Do If You Accidentally Claimed a Facebook Page/Ad Account Instead of Requesting Access
Facebook Business Manager is a fantastic tool that makes managing clients a dream. Companies can quickly give or terminate access to employees in a single location. In order to perform this task however, access must be requested to an account. […]