How To View Search Console Queries, Clicks & Landing Pages In One Location
Have you ever wanted to see query and landing page data in one spot? Now, I know what you're thinking... can't you view a list of queries and pages in Search Console and Google Analytics? Yes, you absolutely can but there is not an option to view them together. Search Console allows you to see a list of queries, but to view the pages you have to click on that specific query and cannot be filtered together. In Google Analytics, you can view search queries but again cannot add a secondary dimension allowing you to place search query and landing page data in one table. We have the answer to this dilemma, thanks to a handy reporting tool, Google Data Studio.
Check out our Wednesday Wisdom from Greg! He shows you how you can build a custom table with the specific dimensions and metrics you choose in Data Studio. That's right, you have the option to display queries and their landing pages together, including the number of URL clicks. Follow along with Greg in the video above or down below with our step-by-step instructions with screenshots.
Step 1: Creating your table
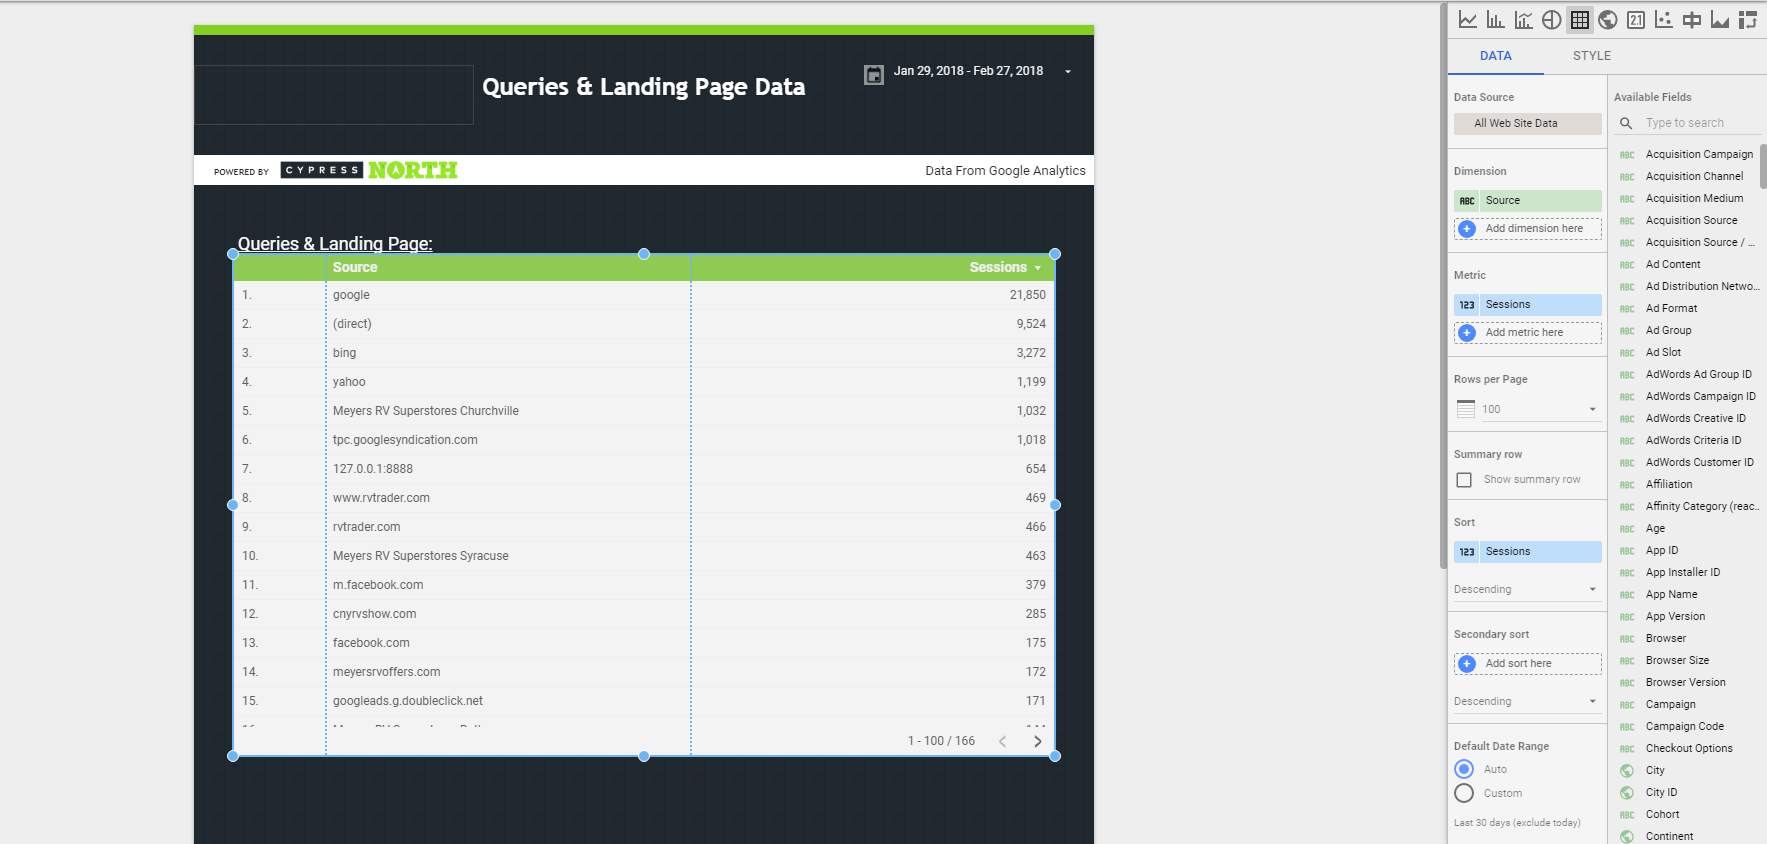
The first step is to create your table. To do this you will go to the toolbar at the top and find the chart symbol.
![]()
Next, select the table to start adding the dimensions and metrics you want to display. You can find those in the right-hand toolbar.
Step 2: Selecting Your Dimensions & Metrics
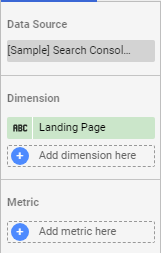
Using the right-hand toolbar, set your source to "Search Console" and then you can choose the dimensions & metrics you want to display.
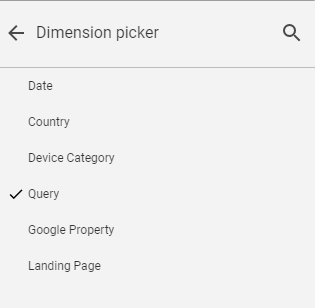
When you open the dimension picker select "query." To add another dimension click "Add dimension here" and choose "landing page" from the menu. Repeat the same process for the metric and select "URL Clicks."
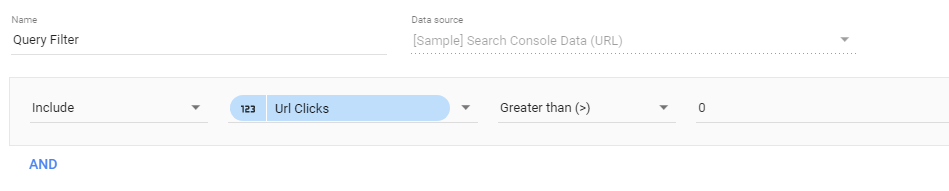
Tip: If you want to only show URL clicks greater than zero, you can create a filter located at the bottom of your toolbar.

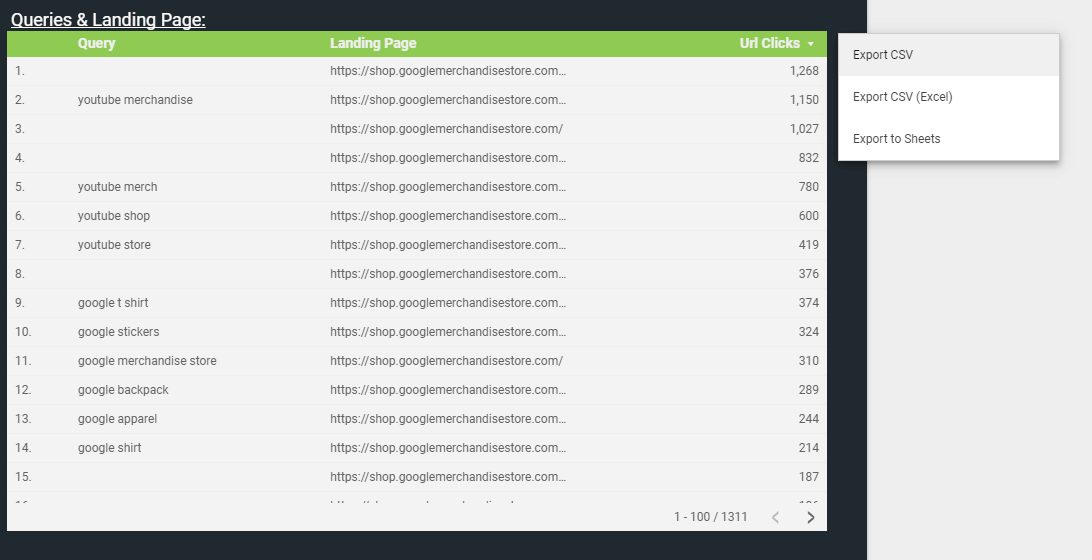
Step 3: Exporting Your Data
Once you have created your table you have the option of exporting it into google sheets, excel or a csv. Then you can manipulate this data in any way you see fit.
And it's as simple as that! We hope this short guide has benefited you. Follow along on our social media for future Wednesdays Wisdom and keep a lookout for more helpful blogs like this one!
Related Resources

Choosing the Right Digital Marketing Career Path as a New Marketer
Learn more about the different career opportunities in digital marketing by exploring the roles of SEO and PPC specialists. Gain insights into key skills, tools, and strategies to help you determine the best path for your professional career.

Google & Apple Business Profiles: A Comprehensive Overview
Having an accurate & up-to-date business profile is very beneficial to any business. Read on to learn how to set these up on Google & Apple, what each platform offers, and some things to watch out for.

How to Create a High-Quality Email Sending List in HubSpot
The HubSpot lists tool allows you to create and edit lists of contacts, companies, or deals based on specific property values and attributes. This blog post will review the ins and outs of HubSpot lists and the different components of using and optimizing them for email marketing that works.

How to Set Up Google Ads Automated Rules
Learn How To Set Up Automated Rules In Google Ads & When To Use Them In Your Account Automated rules in Google Ads are a feature that can make a digital marketer’s life a bit easier. Our agency uses automated […]

Importing Campaigns from Google Ads into Microsoft Advertising: Everything You Need to Know
Learn How To Import Campaigns Into Microsoft & Common Pitfalls To Watch Out For Building out campaigns in both Google and Microsoft Ads shouldn’t have to take up your whole day. This article will walk you through a comprehensive step-by-step […]

How to Get Started with GA4: A Step-by-Step Guide
Need help setting up GA4 for your company or client’s website? Look no further! This post provides a step-by-step process for creating GA4 properties and best practices to make sure necessary events are tracked and the data flowing into GA4 are accurate.

23 Of The Best Resources For Starting A Digital Marketing Career
The best social media communities, podcasts, newsletters, and certifications for new digital marketers I didn’t know anything about digital marketing when I started as an intern at Cypress North earlier this year. Acronyms like SEO, CPA, and ROAS meant nothing […]

A Marketer’s Website Launch Checklist
SEO, Google Tag Manager Tracking, & Content Planning for a New Website There’s nothing quite like launching a beautiful, brand new website, but it is something that can have ugly consequences if not performed correctly. While marketers aren’t typically responsible […]

How to Use Your CRM for More Effective Advertising and Digital Marketing
Think a digital marketer’s job is done after the conversion? Think again. Performance-based advertising and digital marketing aren’t just about generating traffic and conversions. It’s also about driving quality. It’s about producing a return. It’s about being able to directly […]

Why Don't Multi-Channel Funnel Reports Match Up With Other Reports in Google Analytics?
Why don't numbers from the multi-channel funnel reports match up with numbers for the same metrics in other Google Analytics reports? The discrepancy is largely due to differences in what Google considers direct traffic. Read our guide to gain a full understanding of attribution differences in Google Analytics reporting.

How Agencies Can Succeed in Uncertain Times
On Friday's episode of Marketing O'Clock I tried to give some advice to agencies amidst these challenging times. In case you missed the show last week, you can see the clip & writeup below. Crisis strategies for company morale The […]

Should You Hire A Digital Marketing Agency or Hire In-House: An Unbiased Breakdown
Many small businesses (SMBs) hit that point of growth where they know that they need digital marketing help. That is non-negotiable. But is it better to hire an in-house digital marketers or use an agency? This is an important conversation that we have fairly frequently, so we set out to make the ultimate list of pros and cons of hiring a digital marketing agency.
How to Use the Countdown Customizer in your Google Search Ads
Countdown Customizers are an awesome, little known tool that can take your search ads to the next level. Having the power to create a sense of urgency for potential customers and move them down the conversion funnel can be a […]

Device Targeting With Target CPA Bidding In Google Ads
All device targeting is not created equal. If your Google Ads campaign uses target CPA bidding and you're prioritizing conversions from a certain device, we're willing to bet you're doing it wrong. We rarely see this stipulation highlighted when we research […]

Updated: How To Exclude Mobile Apps From Google Ads Display Campaigns
If you’ve been following us for a while, you’ll know we generally don’t like running ads on mobile apps. Don’t get us wrong, we love apps! They’ve made it easier than ever before to get information and connect with each […]
How To Setup Google Dynamic Remarketing In Shopify
Dynamic remarketing is a powerful tool in your retargeting toolbox. This tag not only serves ads to users who have previously visited your site, but goes a step further to show ads for the specific products they've viewed. You can […]

How To Link (Many) AdWords Accounts with Google Analytics Using The New Bulk Account Linking Option
All of you pro AdWords users who routinely take on clients with many AdWords accounts for different promotions can breathe a collective sigh of relief. This week Google came out with a simple way to connect AdWords and Analytics in bulk! […]

Keyword Research Tips: How To Use Bing Ads Editor To Estimate Positional Volume & Pricing
If you are a search pro using Bing, you'll likely spend a good chunk of time living in the Bing Ads Editor. Much like Google's AdWords Editor, this standalone desktop program saves advertisers time and energy by allowing for bulk […]

How to Find Conversion Time Lag Report in Google Analytics
When it comes to analyzing conversions on your site, keep in mind that not everyone makes decisions the same way. Some people may visit your site, find what they're looking for, and convert in one visit -- that is, they […]

How To View Geographic & Location Data Directly Within Google AdWords
When it comes to AdWords, all locations are not created equal. It's important to track which locations are converting -- and which aren't. With AdWords, you can increase or decrease bids based on the location you're targeting, and diving into […]